[←][→] ath
| functional annotation | ||||||||||||||||||||||||||||||||||||||||||||||||||
| Function | biotin F |


|
||||||||||||||||||||||||||||||||||||||||||||||||
| GO BP |
|
|||||||||||||||||||||||||||||||||||||||||||||||||
| GO CC |
|
|||||||||||||||||||||||||||||||||||||||||||||||||
| GO MF |
|
|||||||||||||||||||||||||||||||||||||||||||||||||
| KEGG | ath00780 [list] [network] Biotin metabolism (16 genes) |  |
||||||||||||||||||||||||||||||||||||||||||||||||
| Protein | NP_001332170.1 NP_196082.2 NP_974731.1 | |||||||||||||||||||||||||||||||||||||||||||||||||
| BLAST | NP_001332170.1 NP_196082.2 NP_974731.1 | |||||||||||||||||||||||||||||||||||||||||||||||||
| Orthologous | [Ortholog page] LOC4327870 (osa) LOC4349380 (osa) LOC11411786 (mtr) LOC100191565 (zma) LOC100268118 (vvi) LOC100776585 (gma) LOC100820189 (gma) LOC101249827 (sly) LOC103847272 (bra) | |||||||||||||||||||||||||||||||||||||||||||||||||
| Subcellular localization wolf |
|
|||||||||||||||||||||||||||||||||||||||||||||||||
| Subcellular localization TargetP |
|
|||||||||||||||||||||||||||||||||||||||||||||||||
| Gene coexpression | ||||||||||||||||||||||||||||||||||||||||||||||||||
| Network*for coexpressed genes |
|
|||||||||||||||||||||||||||||||||||||||||||||||||
|---|---|---|---|---|---|---|---|---|---|---|---|---|---|---|---|---|---|---|---|---|---|---|---|---|---|---|---|---|---|---|---|---|---|---|---|---|---|---|---|---|---|---|---|---|---|---|---|---|---|---|
| Coexpressed gene list |
[Coexpressed gene list for BIOF] | |||||||||||||||||||||||||||||||||||||||||||||||||
| Gene expression | ||||||||||||||||||||||||||||||||||||||||||||||||||
| All samples | [Expression pattern for all samples] | |||||||||||||||||||||||||||||||||||||||||||||||||
| AtGenExpress* (Development) |
250837_at
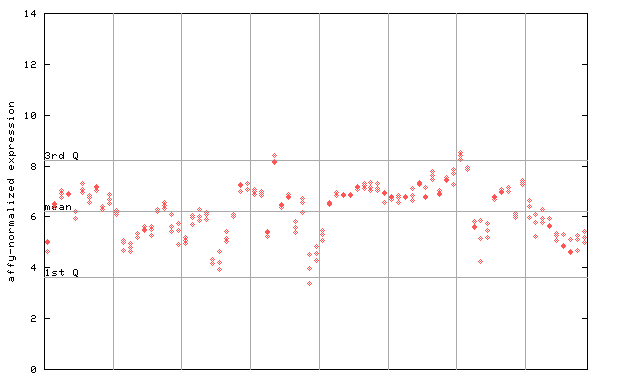
X axis is samples (pdf file), and Y axis is log2-expression. |
|||||||||||||||||||||||||||||||||||||||||||||||||
| AtGenExpress* (Stress) |
250837_at
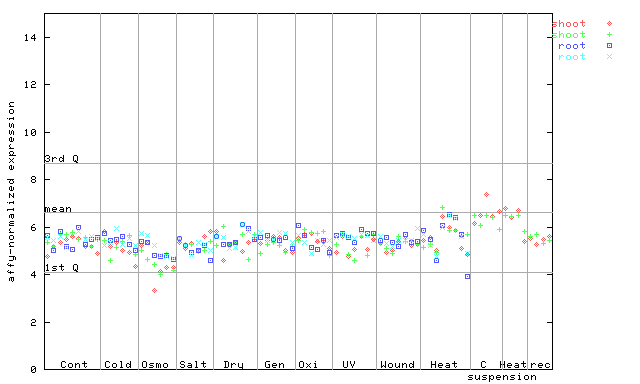
X axis is samples (pdf file), and Y axis is log2-expression. |
|||||||||||||||||||||||||||||||||||||||||||||||||
| AtGenExpress* (Hormone) |
250837_at
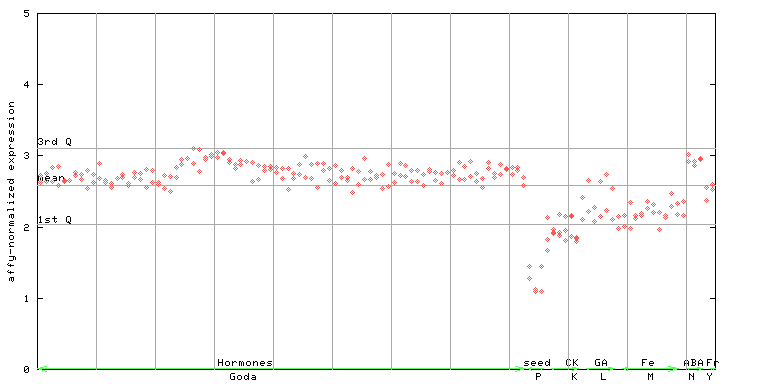
X axis is samples (xls file), and Y axis is log-expression. |
|||||||||||||||||||||||||||||||||||||||||||||||||


")
")
")
")
")
| Link to other DBs | ||
| Entrez Gene ID | 830339 |
|
| Refseq ID (protein) | NP_001332170.1 | |
| NP_196082.2 | |
|
| NP_974731.1 | |
|
The preparation time of this page was 0.2 [sec].