[←][→] ath
| functional annotation | ||||||||||||||||||||||||||||||||||||||||||||||
| Function | Protein phosphatase 2C family protein |


|
||||||||||||||||||||||||||||||||||||||||||||
| GO BP |
|
|||||||||||||||||||||||||||||||||||||||||||||
| GO CC |
|
|||||||||||||||||||||||||||||||||||||||||||||
| GO MF |
|
|||||||||||||||||||||||||||||||||||||||||||||
| KEGG | ||||||||||||||||||||||||||||||||||||||||||||||
| Protein | NP_001119180.1 NP_001119181.1 NP_568174.1 | |||||||||||||||||||||||||||||||||||||||||||||
| BLAST | NP_001119180.1 NP_001119181.1 NP_568174.1 | |||||||||||||||||||||||||||||||||||||||||||||
| Orthologous | [Ortholog page] LOC4330350 (osa) LOC7455644 (ppo) LOC7468929 (ppo) LOC9272700 (osa) LOC25479629 (mtr) LOC100258978 (vvi) LOC100273914 (zma) LOC100382074 (zma) LOC100778238 (gma) LOC100806476 (gma) LOC103847015 (bra) LOC103850632 (bra) | |||||||||||||||||||||||||||||||||||||||||||||
| Subcellular localization wolf |
|
|||||||||||||||||||||||||||||||||||||||||||||
| Subcellular localization TargetP |
|
|||||||||||||||||||||||||||||||||||||||||||||
| Gene coexpression | ||||||||||||||||||||||||||||||||||||||||||||||
| Network*for coexpressed genes |
|
|||||||||||||||||||||||||||||||||||||||||||||
|---|---|---|---|---|---|---|---|---|---|---|---|---|---|---|---|---|---|---|---|---|---|---|---|---|---|---|---|---|---|---|---|---|---|---|---|---|---|---|---|---|---|---|---|---|---|---|
| Coexpressed gene list |
[Coexpressed gene list for AT5G06750] | |||||||||||||||||||||||||||||||||||||||||||||
| Gene expression | ||||||||||||||||||||||||||||||||||||||||||||||
| All samples | [Expression pattern for all samples] | |||||||||||||||||||||||||||||||||||||||||||||
| AtGenExpress* (Development) |
250644_at
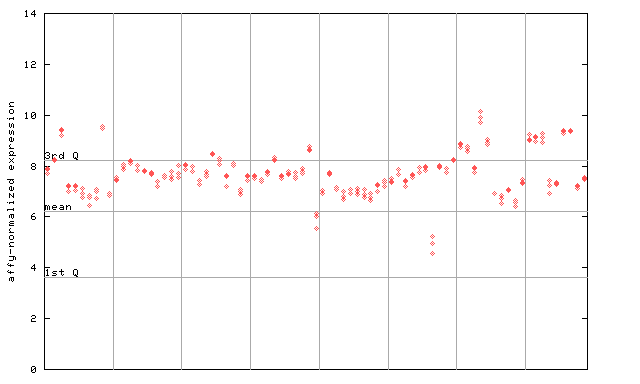
X axis is samples (pdf file), and Y axis is log2-expression. |
|||||||||||||||||||||||||||||||||||||||||||||
| AtGenExpress* (Stress) |
250644_at
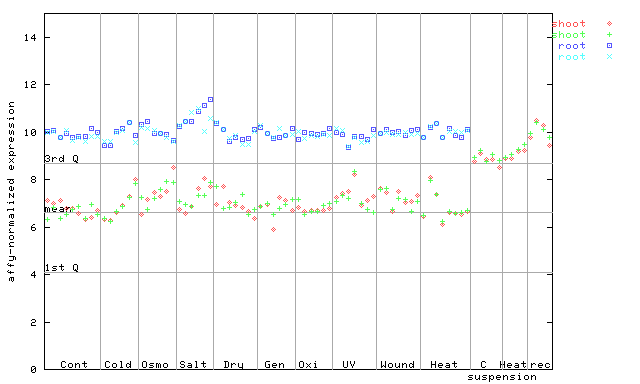
X axis is samples (pdf file), and Y axis is log2-expression. |
|||||||||||||||||||||||||||||||||||||||||||||
| AtGenExpress* (Hormone) |
250644_at
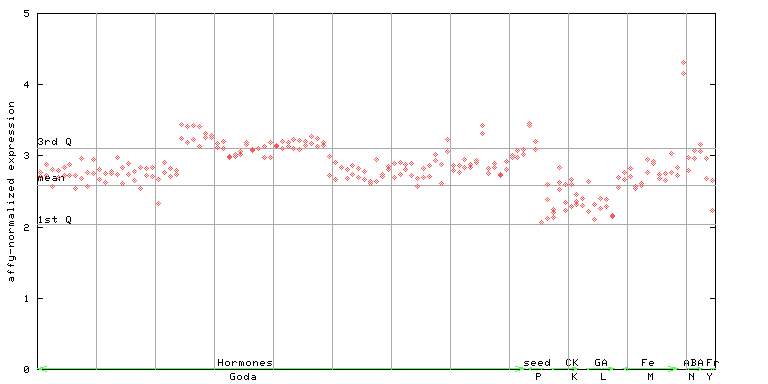
X axis is samples (xls file), and Y axis is log-expression. |
|||||||||||||||||||||||||||||||||||||||||||||


")
")
")
")
| Link to other DBs | ||
| Entrez Gene ID | 830564 |
|
| Refseq ID (protein) | NP_001119180.1 | |
| NP_001119181.1 | |
|
| NP_568174.1 | |
|
The preparation time of this page was 0.2 [sec].