[←][→] ath
| functional annotation | |||||||||||||||||||||||||||||||||||||||||||
| Function | ssDNA-binding transcriptional regulator |


|
|||||||||||||||||||||||||||||||||||||||||
| GO BP |
|
||||||||||||||||||||||||||||||||||||||||||
| GO CC |
|
||||||||||||||||||||||||||||||||||||||||||
| GO MF |
|
||||||||||||||||||||||||||||||||||||||||||
| KEGG | |||||||||||||||||||||||||||||||||||||||||||
| Protein | NP_001119194.1 NP_001318516.1 NP_001332125.1 NP_001332126.1 NP_196487.1 | ||||||||||||||||||||||||||||||||||||||||||
| BLAST | NP_001119194.1 NP_001318516.1 NP_001332125.1 NP_001332126.1 NP_196487.1 | ||||||||||||||||||||||||||||||||||||||||||
| Orthologous | [Ortholog page] AT5G09240 (ath) LOC4329646 (osa) LOC7466762 (ppo) LOC11424996 (mtr) LOC100245748 (vvi) LOC100286301 (zma) LOC100499936 (gma) LOC100820368 (gma) LOC101257234 (sly) LOC103847194 (bra) LOC103850717 (bra) | ||||||||||||||||||||||||||||||||||||||||||
| Subcellular localization wolf |
|
||||||||||||||||||||||||||||||||||||||||||
| Subcellular localization TargetP |
|
||||||||||||||||||||||||||||||||||||||||||
| Gene coexpression | |||||||||||||||||||||||||||||||||||||||||||
| Network*for coexpressed genes |
|
||||||||||||||||||||||||||||||||||||||||||
|---|---|---|---|---|---|---|---|---|---|---|---|---|---|---|---|---|---|---|---|---|---|---|---|---|---|---|---|---|---|---|---|---|---|---|---|---|---|---|---|---|---|---|---|
| Coexpressed gene list |
[Coexpressed gene list for KIWI] | ||||||||||||||||||||||||||||||||||||||||||
| Gene expression | |||||||||||||||||||||||||||||||||||||||||||
| All samples | [Expression pattern for all samples] | ||||||||||||||||||||||||||||||||||||||||||
| AtGenExpress* (Development) |
245896_at
X axis is samples (pdf file), and Y axis is log2-expression. |
||||||||||||||||||||||||||||||||||||||||||
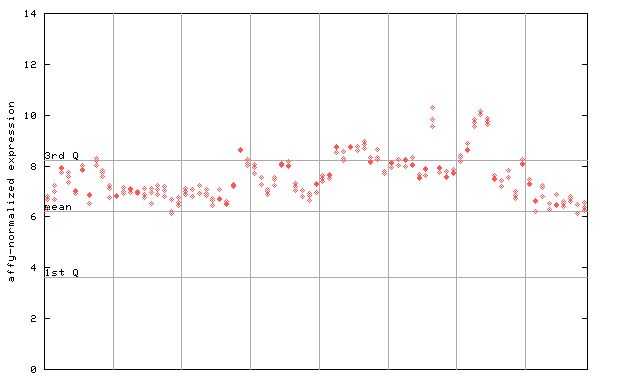
| AtGenExpress* (Stress) |
245896_at
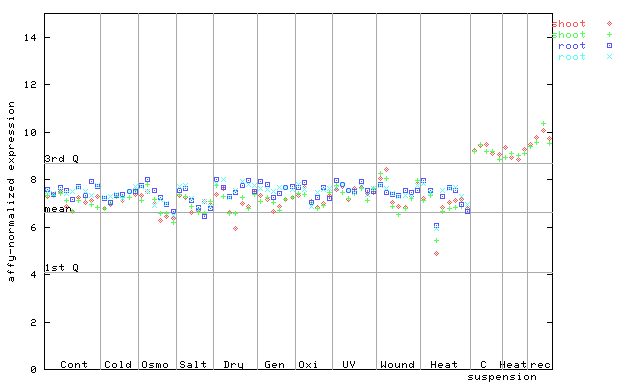
X axis is samples (pdf file), and Y axis is log2-expression. |
||||||||||||||||||||||||||||||||||||||||||
| AtGenExpress* (Hormone) |
245896_at
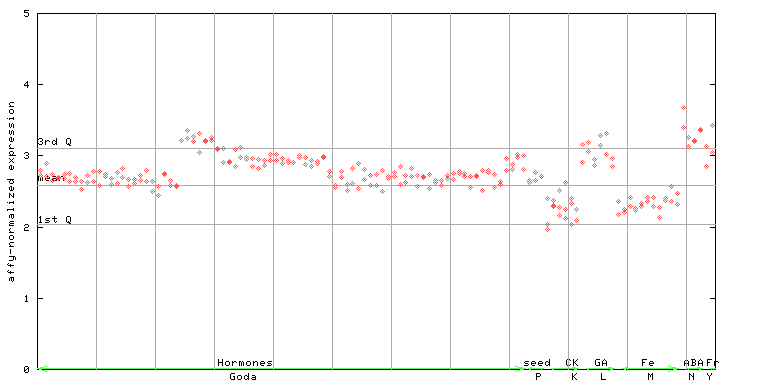
X axis is samples (xls file), and Y axis is log-expression. |
||||||||||||||||||||||||||||||||||||||||||


")
")
| Link to other DBs | ||
| Entrez Gene ID | 830784 |
|
| Refseq ID (protein) | NP_001119194.1 | |
| NP_001318516.1 | |
|
| NP_001332125.1 | |
|
| NP_001332126.1 | |
|
| NP_196487.1 | |
|
The preparation time of this page was 0.2 [sec].