[←][→] ath
| functional annotation | ||||||||||||||||||||||||||||||||||||||
| Function | MATE efflux family protein |


|
||||||||||||||||||||||||||||||||||||
| GO BP |
|
|||||||||||||||||||||||||||||||||||||
| GO CC |
|
|||||||||||||||||||||||||||||||||||||
| GO MF |
|
|||||||||||||||||||||||||||||||||||||
| KEGG | ||||||||||||||||||||||||||||||||||||||
| Protein | NP_001330411.1 NP_001330412.1 NP_197272.2 | |||||||||||||||||||||||||||||||||||||
| BLAST | NP_001330411.1 NP_001330412.1 NP_197272.2 | |||||||||||||||||||||||||||||||||||||
| Orthologous | [Ortholog page] AT3G03620 (ath) LOC7454485 (ppo) LOC7474027 (ppo) LOC100241535 (vvi) LOC100251800 (vvi) LOC100256934 (vvi) LOC100262031 (vvi) LOC100265386 (vvi) LOC101257226 (sly) LOC103828202 (bra) LOC103833197 (bra) LOC103851123 (bra) LOC103855171 (bra) | |||||||||||||||||||||||||||||||||||||
| Subcellular localization wolf |
|
|||||||||||||||||||||||||||||||||||||
| Subcellular localization TargetP |
|
|||||||||||||||||||||||||||||||||||||
| Gene coexpression | ||||||||||||||||||||||||||||||||||||||
| Network*for coexpressed genes |
|
|||||||||||||||||||||||||||||||||||||
|---|---|---|---|---|---|---|---|---|---|---|---|---|---|---|---|---|---|---|---|---|---|---|---|---|---|---|---|---|---|---|---|---|---|---|---|---|---|---|
| Coexpressed gene list |
[Coexpressed gene list for AT5G17700] | |||||||||||||||||||||||||||||||||||||
| Gene expression | ||||||||||||||||||||||||||||||||||||||
| All samples | [Expression pattern for all samples] | |||||||||||||||||||||||||||||||||||||
| AtGenExpress* (Development) |
250045_at
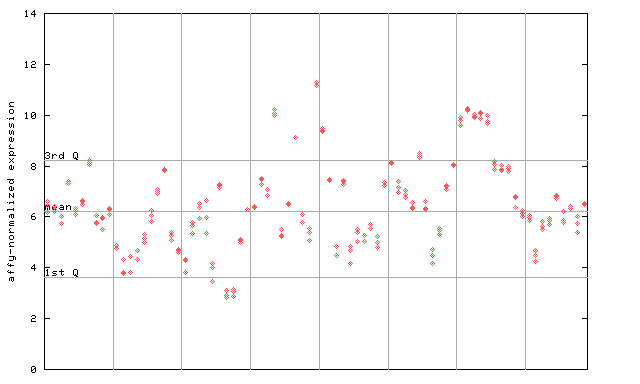
X axis is samples (pdf file), and Y axis is log2-expression. |
|||||||||||||||||||||||||||||||||||||
| AtGenExpress* (Stress) |
250045_at
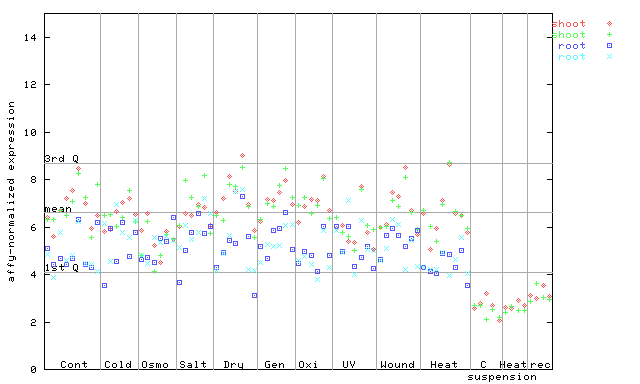
X axis is samples (pdf file), and Y axis is log2-expression. |
|||||||||||||||||||||||||||||||||||||
| AtGenExpress* (Hormone) |
250045_at
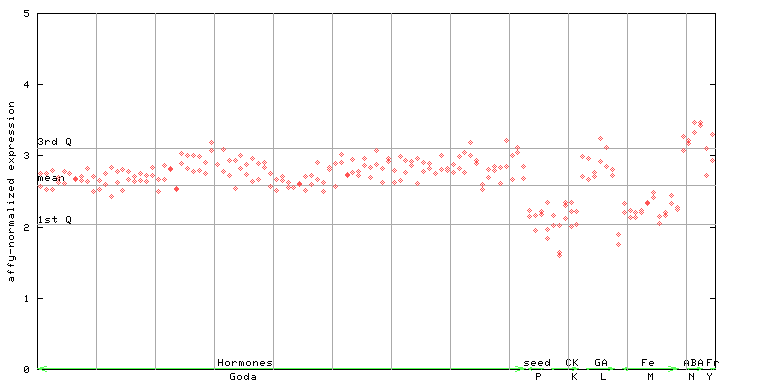
X axis is samples (xls file), and Y axis is log-expression. |
|||||||||||||||||||||||||||||||||||||


")
")
| Link to other DBs | ||
| Entrez Gene ID | 831637 |
|
| Refseq ID (protein) | NP_001330411.1 | |
| NP_001330412.1 | |
|
| NP_197272.2 | |
|
The preparation time of this page was 0.2 [sec].