[←][→] ath
| functional annotation | ||||||||||||||||||||||||||||||||||||||||||||||||||||
| Function | alpha/beta-Hydrolases superfamily protein |


|
||||||||||||||||||||||||||||||||||||||||||||||||||
| GO BP |
|
|||||||||||||||||||||||||||||||||||||||||||||||||||
| GO CC |
|
|||||||||||||||||||||||||||||||||||||||||||||||||||
| GO MF |
|
|||||||||||||||||||||||||||||||||||||||||||||||||||
| KEGG | ||||||||||||||||||||||||||||||||||||||||||||||||||||
| Protein | NP_001119241.1 NP_197280.2 | |||||||||||||||||||||||||||||||||||||||||||||||||||
| BLAST | NP_001119241.1 NP_197280.2 | |||||||||||||||||||||||||||||||||||||||||||||||||||
| Orthologous | [Ortholog page] AT5G17720 (ath) LOC4344329 (osa) LOC11426956 (mtr) LOC100267301 (vvi) LOC100775258 (gma) LOC101262576 (sly) LOC103633579 (zma) LOC103845900 (bra) LOC103846213 (bra) | |||||||||||||||||||||||||||||||||||||||||||||||||||
| Subcellular localization wolf |
|
|||||||||||||||||||||||||||||||||||||||||||||||||||
| Subcellular localization TargetP |
|
|||||||||||||||||||||||||||||||||||||||||||||||||||
| Gene coexpression | ||||||||||||||||||||||||||||||||||||||||||||||||||||
| Network*for coexpressed genes |
|
|||||||||||||||||||||||||||||||||||||||||||||||||||
|---|---|---|---|---|---|---|---|---|---|---|---|---|---|---|---|---|---|---|---|---|---|---|---|---|---|---|---|---|---|---|---|---|---|---|---|---|---|---|---|---|---|---|---|---|---|---|---|---|---|---|---|---|
| Coexpressed gene list |
[Coexpressed gene list for AT5G17780] | |||||||||||||||||||||||||||||||||||||||||||||||||||
| Gene expression | ||||||||||||||||||||||||||||||||||||||||||||||||||||
| All samples | [Expression pattern for all samples] | |||||||||||||||||||||||||||||||||||||||||||||||||||
| AtGenExpress* (Development) |
250049_at
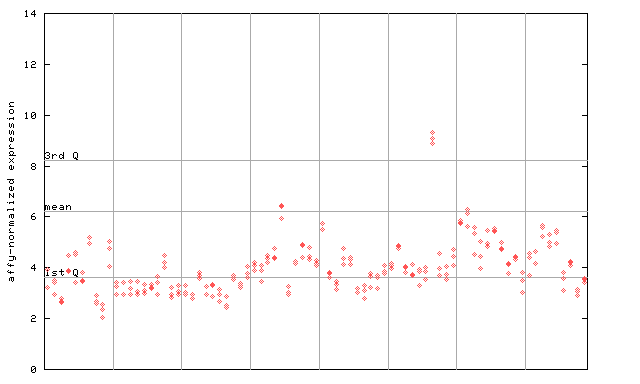
X axis is samples (pdf file), and Y axis is log2-expression. |
|||||||||||||||||||||||||||||||||||||||||||||||||||
| AtGenExpress* (Stress) |
250049_at
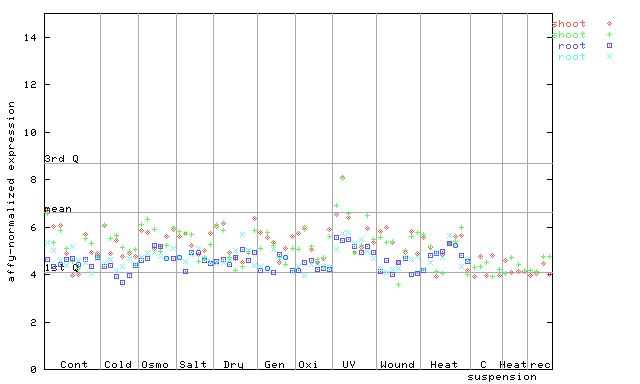
X axis is samples (pdf file), and Y axis is log2-expression. |
|||||||||||||||||||||||||||||||||||||||||||||||||||
| AtGenExpress* (Hormone) |
250049_at
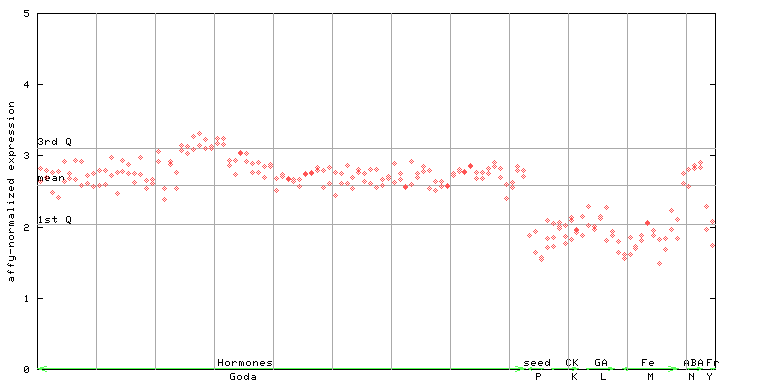
X axis is samples (xls file), and Y axis is log-expression. |
|||||||||||||||||||||||||||||||||||||||||||||||||||


")
")
")
| Link to other DBs | ||
| Entrez Gene ID | 831646 |
|
| Refseq ID (protein) | NP_001119241.1 | |
| NP_197280.2 | |
|
The preparation time of this page was 0.2 [sec].