[←][→] ath
| functional annotation | ||||||||||||||||||||||||||||||||||||||||||||||||||||||||||||||
| Function | malate synthase |


|
||||||||||||||||||||||||||||||||||||||||||||||||||||||||||||
| GO BP |
|
|||||||||||||||||||||||||||||||||||||||||||||||||||||||||||||
| GO CC |
|
|||||||||||||||||||||||||||||||||||||||||||||||||||||||||||||
| GO MF |
|
|||||||||||||||||||||||||||||||||||||||||||||||||||||||||||||
| KEGG | ath00620 [list] [network] Pyruvate metabolism (86 genes) |  |
||||||||||||||||||||||||||||||||||||||||||||||||||||||||||||
| ath00630 [list] [network] Glyoxylate and dicarboxylate metabolism (78 genes) | |
|||||||||||||||||||||||||||||||||||||||||||||||||||||||||||||
| ath01200 [list] [network] Carbon metabolism (273 genes) | |
|||||||||||||||||||||||||||||||||||||||||||||||||||||||||||||
| Protein | NP_001190219.1 NP_196006.1 | |||||||||||||||||||||||||||||||||||||||||||||||||||||||||||||
| BLAST | NP_001190219.1 NP_196006.1 | |||||||||||||||||||||||||||||||||||||||||||||||||||||||||||||
| Orthologous | [Ortholog page] LOC542252 (zma) MS (gma) LOC9268154 (osa) LOC25500778 (mtr) LOC100261216 (vvi) LOC101263993 (sly) LOC101267103 (sly) LOC101267395 (sly) LOC103850517 (bra) | |||||||||||||||||||||||||||||||||||||||||||||||||||||||||||||
| Subcellular localization wolf |
|
|||||||||||||||||||||||||||||||||||||||||||||||||||||||||||||
| Subcellular localization TargetP |
|
|||||||||||||||||||||||||||||||||||||||||||||||||||||||||||||
| Gene coexpression | ||||||||||||||||||||||||||||||||||||||||||||||||||||||||||||||
| Network*for coexpressed genes |
|
|||||||||||||||||||||||||||||||||||||||||||||||||||||||||||||
|---|---|---|---|---|---|---|---|---|---|---|---|---|---|---|---|---|---|---|---|---|---|---|---|---|---|---|---|---|---|---|---|---|---|---|---|---|---|---|---|---|---|---|---|---|---|---|---|---|---|---|---|---|---|---|---|---|---|---|---|---|---|---|
| Coexpressed gene list |
[Coexpressed gene list for MLS] | |||||||||||||||||||||||||||||||||||||||||||||||||||||||||||||
| Gene expression | ||||||||||||||||||||||||||||||||||||||||||||||||||||||||||||||
| All samples | [Expression pattern for all samples] | |||||||||||||||||||||||||||||||||||||||||||||||||||||||||||||
| AtGenExpress* (Development) |
250868_at
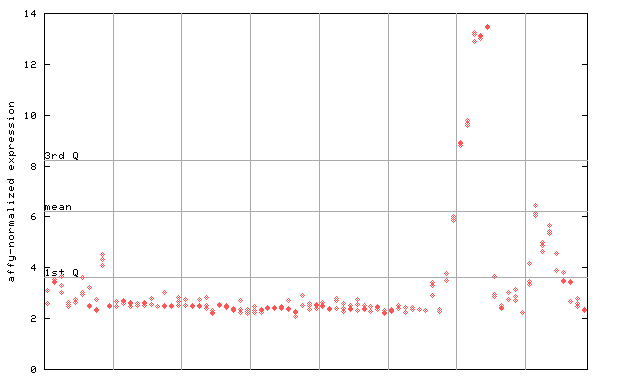
X axis is samples (pdf file), and Y axis is log2-expression. |
|||||||||||||||||||||||||||||||||||||||||||||||||||||||||||||
| AtGenExpress* (Stress) |
250868_at
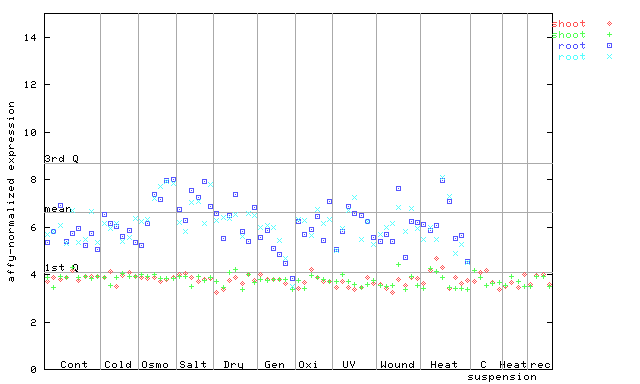
X axis is samples (pdf file), and Y axis is log2-expression. |
|||||||||||||||||||||||||||||||||||||||||||||||||||||||||||||
| AtGenExpress* (Hormone) |
250868_at
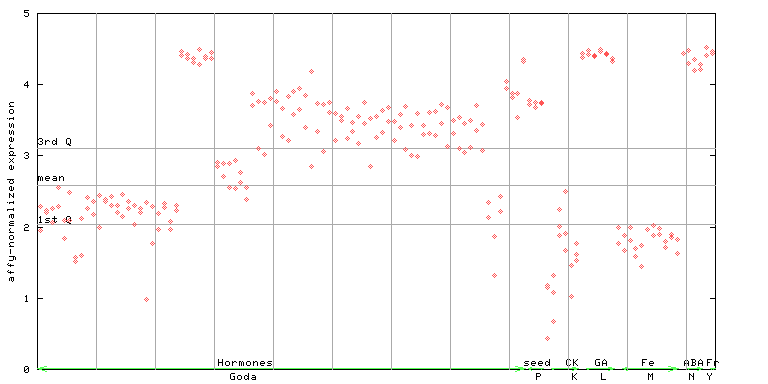
X axis is samples (xls file), and Y axis is log-expression. |
|||||||||||||||||||||||||||||||||||||||||||||||||||||||||||||


")
")
")
| Link to other DBs | ||
| Entrez Gene ID | 831690 |
|
| Refseq ID (protein) | NP_001190219.1 | |
| NP_196006.1 | |
|
The preparation time of this page was 0.2 [sec].