[←][→] ath
| functional annotation | ||||||||||||||||||||||||||||||||||
| Function | CRT (chloroquine-resistance transporter)-like transporter 1 |


|
||||||||||||||||||||||||||||||||
| GO BP |
|
|||||||||||||||||||||||||||||||||
| GO CC |
|
|||||||||||||||||||||||||||||||||
| GO MF |
|
|||||||||||||||||||||||||||||||||
| KEGG | ||||||||||||||||||||||||||||||||||
| Protein | NP_001154721.1 NP_568373.1 | |||||||||||||||||||||||||||||||||
| BLAST | NP_001154721.1 NP_568373.1 | |||||||||||||||||||||||||||||||||
| Orthologous | [Ortholog page] CLT3 (ath) LOC4325409 (osa) LOC7475027 (ppo) LOC11431856 (mtr) LOC25479779 (mtr) LOC100265335 (vvi) LOC100272467 (zma) LOC100776428 (gma) LOC100780283 (gma) LOC100819888 (gma) LOC101254772 (sly) LOC103636274 (zma) LOC103850817 (bra) LOC103851269 (bra) | |||||||||||||||||||||||||||||||||
| Subcellular localization wolf |
|
|||||||||||||||||||||||||||||||||
| Subcellular localization TargetP |
|
|||||||||||||||||||||||||||||||||
| Gene coexpression | ||||||||||||||||||||||||||||||||||
| Network*for coexpressed genes |
|
|||||||||||||||||||||||||||||||||
|---|---|---|---|---|---|---|---|---|---|---|---|---|---|---|---|---|---|---|---|---|---|---|---|---|---|---|---|---|---|---|---|---|---|---|
| Coexpressed gene list |
[Coexpressed gene list for CLT1] | |||||||||||||||||||||||||||||||||
| Gene expression | ||||||||||||||||||||||||||||||||||
| All samples | [Expression pattern for all samples] | |||||||||||||||||||||||||||||||||
| AtGenExpress* (Development) |
246043_at
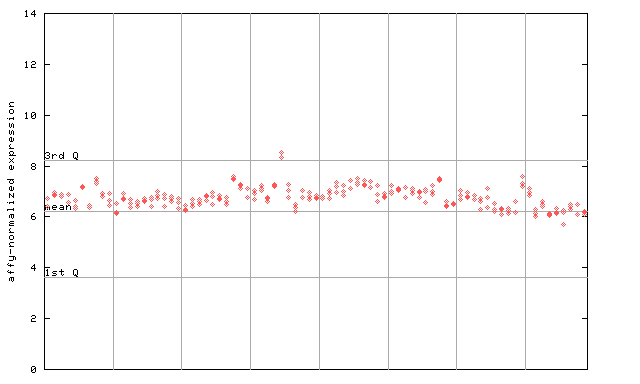
X axis is samples (pdf file), and Y axis is log2-expression. |
|||||||||||||||||||||||||||||||||
| AtGenExpress* (Stress) |
246043_at
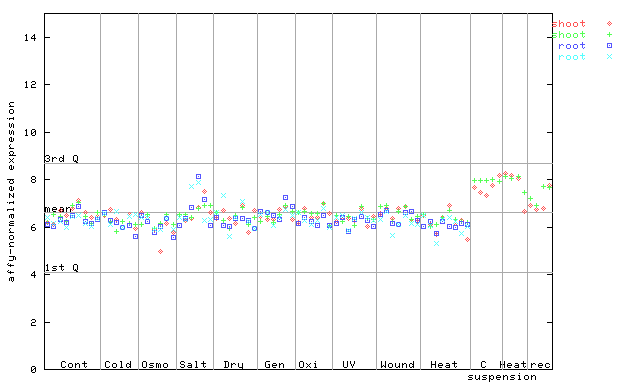
X axis is samples (pdf file), and Y axis is log2-expression. |
|||||||||||||||||||||||||||||||||
| AtGenExpress* (Hormone) |
246043_at
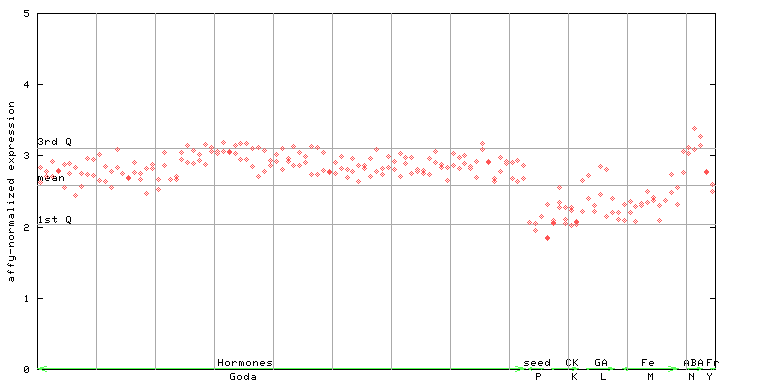
X axis is samples (xls file), and Y axis is log-expression. |
|||||||||||||||||||||||||||||||||


")
| Link to other DBs | ||
| Entrez Gene ID | 832058 |
|
| Refseq ID (protein) | NP_001154721.1 | |
| NP_568373.1 | |
|
The preparation time of this page was 0.1 [sec].