[←][→] ath
| functional annotation | |||||||||||||||||||||||||||||||
| Function | transmembrane protein |


|
|||||||||||||||||||||||||||||
| GO BP |
|
||||||||||||||||||||||||||||||
| GO CC |
|
||||||||||||||||||||||||||||||
| GO MF |
|
||||||||||||||||||||||||||||||
| KEGG | |||||||||||||||||||||||||||||||
| Protein | NP_197458.1 | ||||||||||||||||||||||||||||||
| BLAST | NP_197458.1 | ||||||||||||||||||||||||||||||
| Orthologous | [Ortholog page] LOC4338015 (osa) LOC7458779 (ppo) LOC11408104 (mtr) LOC100242209 (vvi) LOC100278112 (zma) LOC100800512 (gma) LOC102665209 (gma) LOC103851285 (bra) LOC104644277 (sly) | ||||||||||||||||||||||||||||||
| Subcellular localization wolf |
|
||||||||||||||||||||||||||||||
| Subcellular localization TargetP |
|
||||||||||||||||||||||||||||||
| Gene coexpression | |||||||||||||||||||||||||||||||
| Network*for coexpressed genes |
|
||||||||||||||||||||||||||||||
|---|---|---|---|---|---|---|---|---|---|---|---|---|---|---|---|---|---|---|---|---|---|---|---|---|---|---|---|---|---|---|---|
| Coexpressed gene list |
[Coexpressed gene list for AT5G19570] | ||||||||||||||||||||||||||||||
| Gene expression | |||||||||||||||||||||||||||||||
| All samples | [Expression pattern for all samples] | ||||||||||||||||||||||||||||||
| AtGenExpress* (Development) |
245950_at
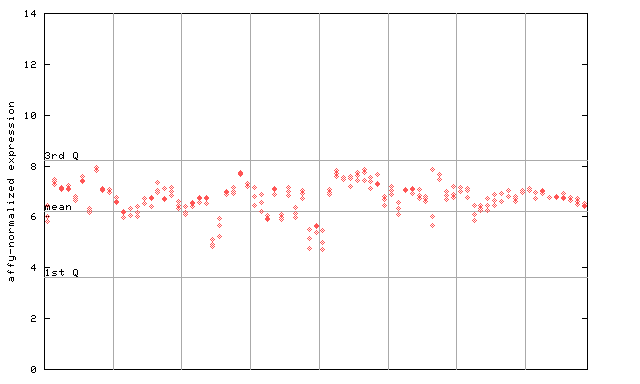
X axis is samples (pdf file), and Y axis is log2-expression. |
||||||||||||||||||||||||||||||
| AtGenExpress* (Stress) |
245950_at
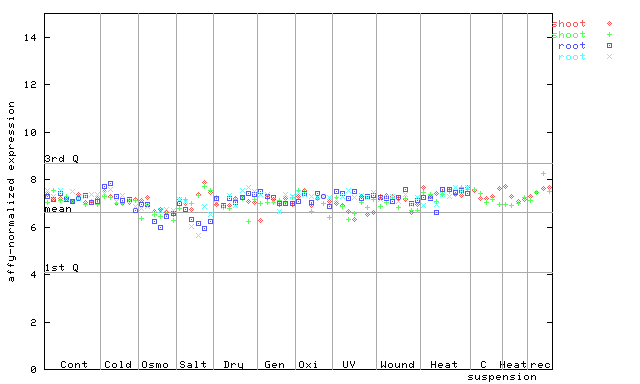
X axis is samples (pdf file), and Y axis is log2-expression. |
||||||||||||||||||||||||||||||
| AtGenExpress* (Hormone) |
245950_at
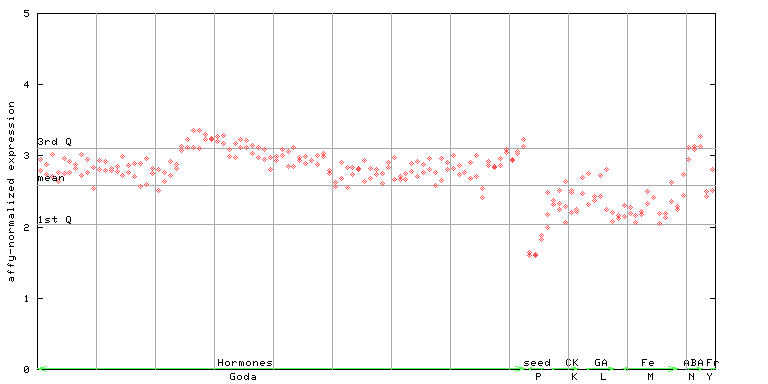
X axis is samples (xls file), and Y axis is log-expression. |
||||||||||||||||||||||||||||||


| Link to other DBs | ||
| Entrez Gene ID | 832077 |
|
| Refseq ID (protein) | NP_197458.1 | |
The preparation time of this page was 0.2 [sec].