[←][→] ath
| functional annotation | |||||||||||||||||||||||||||||||||||||||||||
| Function | sulfate transporter 3;5 |


|
|||||||||||||||||||||||||||||||||||||||||
| GO BP |
|
||||||||||||||||||||||||||||||||||||||||||
| GO CC |
|
||||||||||||||||||||||||||||||||||||||||||
| GO MF |
|
||||||||||||||||||||||||||||||||||||||||||
| KEGG | |||||||||||||||||||||||||||||||||||||||||||
| Protein | NP_568377.1 | ||||||||||||||||||||||||||||||||||||||||||
| BLAST | NP_568377.1 | ||||||||||||||||||||||||||||||||||||||||||
| Orthologous | [Ortholog page] LOC4324697 (osa) LOC4348651 (osa) LOC9266924 (osa) LOC11435931 (mtr) LOC100252518 (vvi) LOC100257654 (vvi) sfp6 (zma) LOC100789107 (gma) LOC101245923 (sly) LOC101261992 (sly) LOC103851288 (bra) LOC103856387 (bra) | ||||||||||||||||||||||||||||||||||||||||||
| Subcellular localization wolf |
|
||||||||||||||||||||||||||||||||||||||||||
| Subcellular localization TargetP |
|
||||||||||||||||||||||||||||||||||||||||||
| Gene coexpression | |||||||||||||||||||||||||||||||||||||||||||
| Network*for coexpressed genes |
|
||||||||||||||||||||||||||||||||||||||||||
|---|---|---|---|---|---|---|---|---|---|---|---|---|---|---|---|---|---|---|---|---|---|---|---|---|---|---|---|---|---|---|---|---|---|---|---|---|---|---|---|---|---|---|---|
| Coexpressed gene list |
[Coexpressed gene list for SULTR3;5] | ||||||||||||||||||||||||||||||||||||||||||
| Gene expression | |||||||||||||||||||||||||||||||||||||||||||
| All samples | [Expression pattern for all samples] | ||||||||||||||||||||||||||||||||||||||||||
| AtGenExpress* (Development) |
245912_at
X axis is samples (pdf file), and Y axis is log2-expression. |
||||||||||||||||||||||||||||||||||||||||||
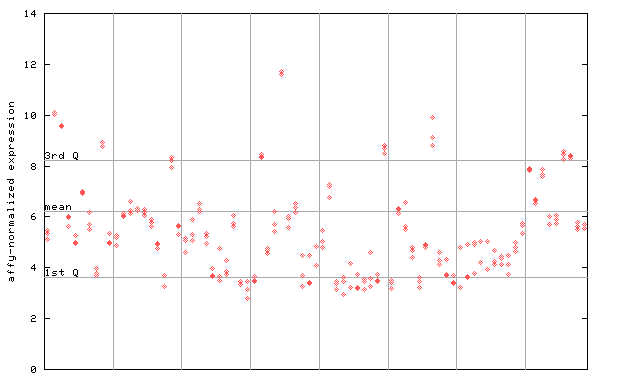
| AtGenExpress* (Stress) |
245912_at
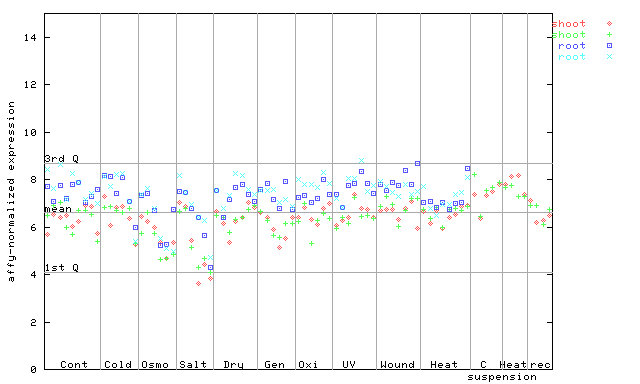
X axis is samples (pdf file), and Y axis is log2-expression. |
||||||||||||||||||||||||||||||||||||||||||
| AtGenExpress* (Hormone) |
245912_at
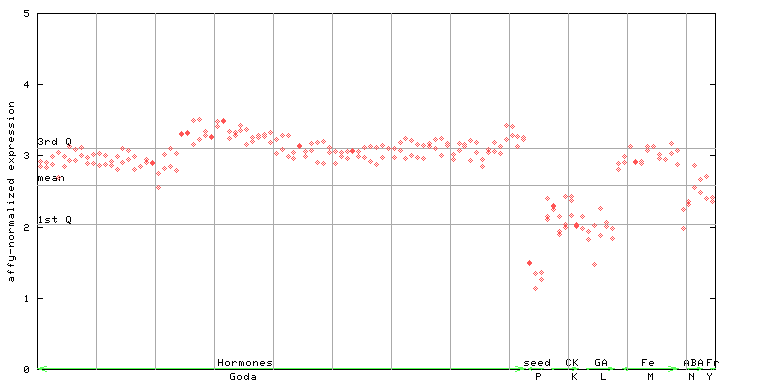
X axis is samples (xls file), and Y axis is log-expression. |
||||||||||||||||||||||||||||||||||||||||||


")
")
| Link to other DBs | ||
| Entrez Gene ID | 832080 |
|
| Refseq ID (protein) | NP_568377.1 | |
The preparation time of this page was 0.2 [sec].