[←][→] ath
| functional annotation | ||||||||||||||||||||||||||||||||||||||
| Function | ribosomal protein large subunit 27 |


|
||||||||||||||||||||||||||||||||||||
| GO BP |
|
|||||||||||||||||||||||||||||||||||||
| GO CC |
|
|||||||||||||||||||||||||||||||||||||
| GO MF |
|
|||||||||||||||||||||||||||||||||||||
| KEGG | ath03010 [list] [network] Ribosome (356 genes) |  |
||||||||||||||||||||||||||||||||||||
| Protein | NP_198911.1 | |||||||||||||||||||||||||||||||||||||
| BLAST | NP_198911.1 | |||||||||||||||||||||||||||||||||||||
| Orthologous | [Ortholog page] LOC4327257 (osa) LOC7495790 (ppo) LOC11411686 (mtr) LOC100260093 (vvi) LOC100283825 (zma) LOC100801145 (gma) LOC100815200 (gma) LOC101244639 (sly) ARP1 (bra) | |||||||||||||||||||||||||||||||||||||
| Subcellular localization wolf |
|
|||||||||||||||||||||||||||||||||||||
| Subcellular localization TargetP |
|
|||||||||||||||||||||||||||||||||||||
| Gene coexpression | ||||||||||||||||||||||||||||||||||||||
| Network*for coexpressed genes |
|
|||||||||||||||||||||||||||||||||||||
|---|---|---|---|---|---|---|---|---|---|---|---|---|---|---|---|---|---|---|---|---|---|---|---|---|---|---|---|---|---|---|---|---|---|---|---|---|---|---|
| Coexpressed gene list |
[Coexpressed gene list for RPL27] | |||||||||||||||||||||||||||||||||||||
| Gene expression | ||||||||||||||||||||||||||||||||||||||
| All samples | [Expression pattern for all samples] | |||||||||||||||||||||||||||||||||||||
| AtGenExpress* (Development) |
249331_at
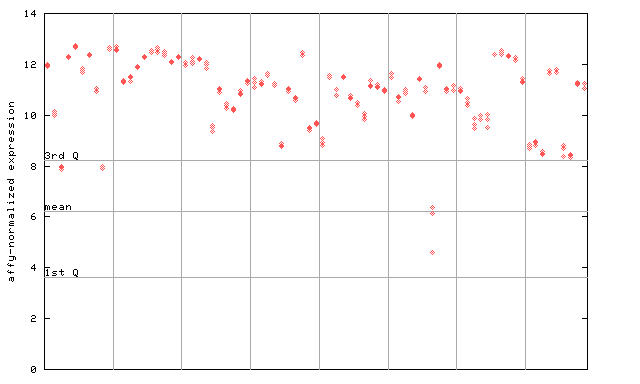
X axis is samples (pdf file), and Y axis is log2-expression. |
|||||||||||||||||||||||||||||||||||||
| AtGenExpress* (Stress) |
249331_at
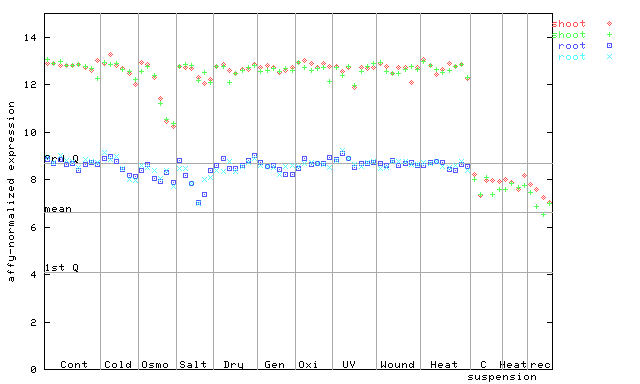
X axis is samples (pdf file), and Y axis is log2-expression. |
|||||||||||||||||||||||||||||||||||||
| AtGenExpress* (Hormone) |
249331_at
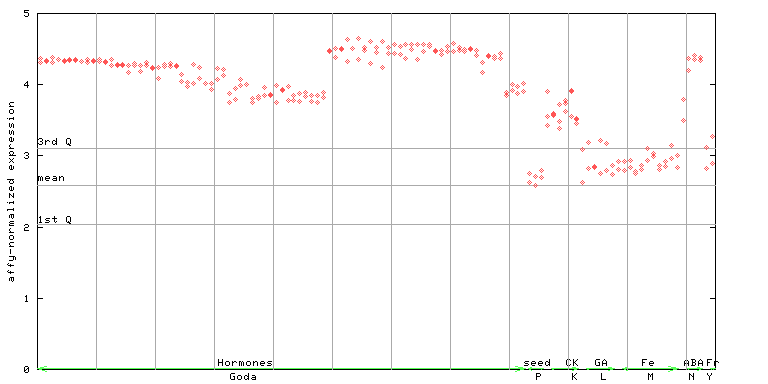
X axis is samples (xls file), and Y axis is log-expression. |
|||||||||||||||||||||||||||||||||||||


")
")
| Link to other DBs | ||
| Entrez Gene ID | 834097 |
|
| Refseq ID (protein) | NP_198911.1 | |
The preparation time of this page was 0.3 [sec].