[←][→] ath
| functional annotation | ||||||||||||||||||||||||||
| Function | transmembrane protein |


|
||||||||||||||||||||||||
| GO BP |
|
|||||||||||||||||||||||||
| GO CC |
|
|||||||||||||||||||||||||
| GO MF |
|
|||||||||||||||||||||||||
| KEGG | ||||||||||||||||||||||||||
| Protein | NP_199569.1 | |||||||||||||||||||||||||
| BLAST | NP_199569.1 | |||||||||||||||||||||||||
| Orthologous | [Ortholog page] AT4G17250 (ath) LOC7479208 (ppo) LOC11410679 (mtr) LOC11426341 (mtr) LOC100262529 (vvi) LOC100794740 (gma) LOC100814359 (gma) LOC101253112 (sly) LOC103834004 (bra) LOC103847425 (bra) LOC103860903 (bra) LOC109120852 (sly) | |||||||||||||||||||||||||
| Subcellular localization wolf |
|
|||||||||||||||||||||||||
| Subcellular localization TargetP |
|
|||||||||||||||||||||||||
| Gene coexpression | ||||||||||||||||||||||||||
| Network*for coexpressed genes |
|
|||||||||||||||||||||||||
|---|---|---|---|---|---|---|---|---|---|---|---|---|---|---|---|---|---|---|---|---|---|---|---|---|---|---|
| Coexpressed gene list |
[Coexpressed gene list for ASG7] | |||||||||||||||||||||||||
| Gene expression | ||||||||||||||||||||||||||
| All samples | [Expression pattern for all samples] | |||||||||||||||||||||||||
| AtGenExpress* (Development) |
248766_at
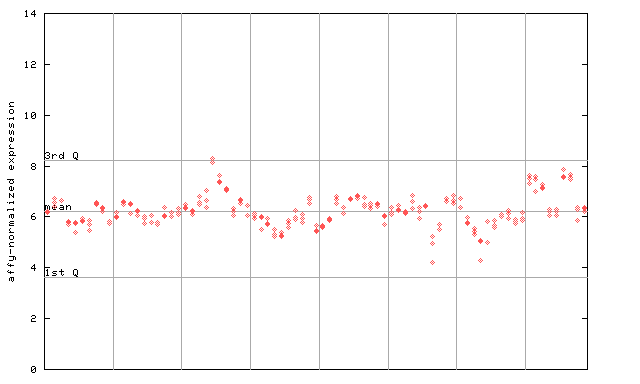
X axis is samples (pdf file), and Y axis is log2-expression. |
|||||||||||||||||||||||||
| AtGenExpress* (Stress) |
248766_at
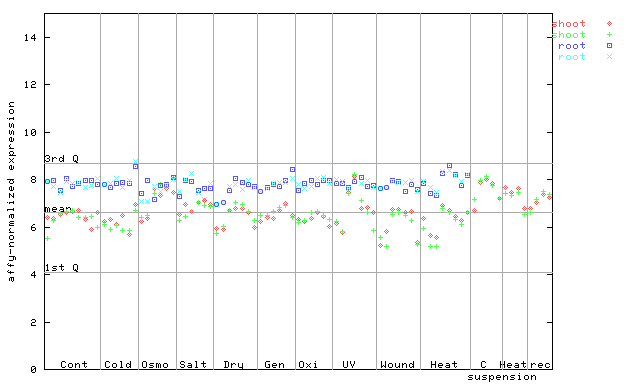
X axis is samples (pdf file), and Y axis is log2-expression. |
|||||||||||||||||||||||||
| AtGenExpress* (Hormone) |
248766_at
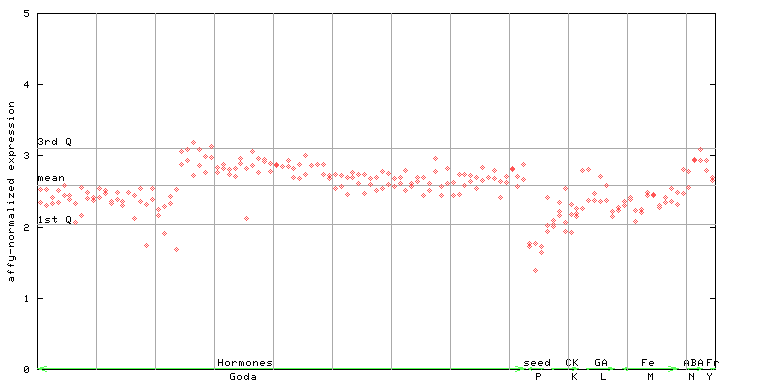
X axis is samples (xls file), and Y axis is log-expression. |
|||||||||||||||||||||||||


| Link to other DBs | ||
| Entrez Gene ID | 834808 |
|
| Refseq ID (protein) | NP_199569.1 | |
The preparation time of this page was 0.1 [sec].