[←][→] ath
| functional annotation | ||||||||||||||||||||||||||||||||||||
| Function | fanconi anemia group I-like protein |


|
||||||||||||||||||||||||||||||||||
| GO BP |
|
|||||||||||||||||||||||||||||||||||
| GO CC |
|
|||||||||||||||||||||||||||||||||||
| GO MF |
|
|||||||||||||||||||||||||||||||||||
| KEGG | ||||||||||||||||||||||||||||||||||||
| Protein | NP_001119400.1 NP_001331415.1 NP_001331416.1 NP_199722.2 | |||||||||||||||||||||||||||||||||||
| BLAST | NP_001119400.1 NP_001331415.1 NP_001331416.1 NP_199722.2 | |||||||||||||||||||||||||||||||||||
| Orthologous | [Ortholog page] LOC4332794 (osa) LOC7496685 (ppo) LOC100260122 (vvi) LOC101258408 (sly) LOC103634632 (zma) LOC103854575 (bra) | |||||||||||||||||||||||||||||||||||
| Subcellular localization wolf |
|
|||||||||||||||||||||||||||||||||||
| Subcellular localization TargetP |
|
|||||||||||||||||||||||||||||||||||
| Gene coexpression | ||||||||||||||||||||||||||||||||||||
| Network*for coexpressed genes |
|
|||||||||||||||||||||||||||||||||||
|---|---|---|---|---|---|---|---|---|---|---|---|---|---|---|---|---|---|---|---|---|---|---|---|---|---|---|---|---|---|---|---|---|---|---|---|---|
| Coexpressed gene list |
[Coexpressed gene list for AT5G49110] | |||||||||||||||||||||||||||||||||||
| Gene expression | ||||||||||||||||||||||||||||||||||||
| All samples | [Expression pattern for all samples] | |||||||||||||||||||||||||||||||||||
| AtGenExpress* (Development) |
248641_at
X axis is samples (pdf file), and Y axis is log2-expression. |
|||||||||||||||||||||||||||||||||||
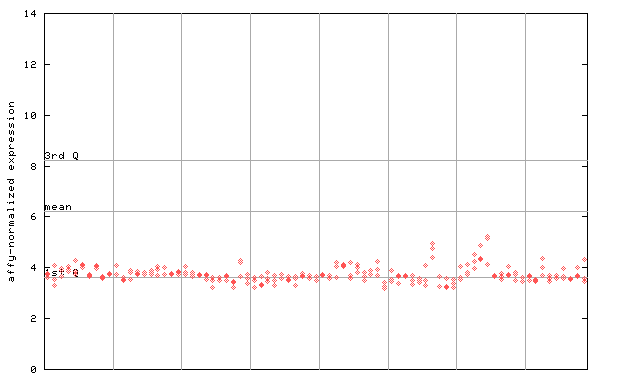
| AtGenExpress* (Stress) |
248641_at
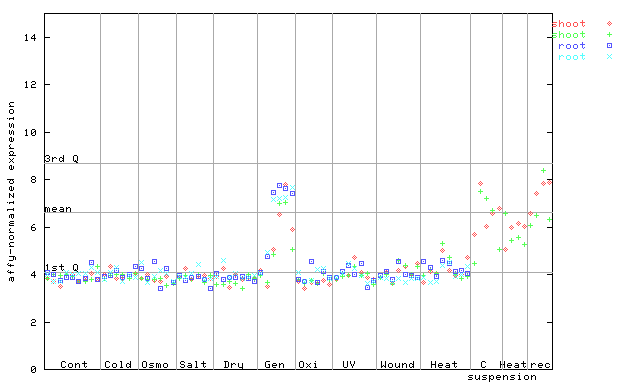
X axis is samples (pdf file), and Y axis is log2-expression. |
|||||||||||||||||||||||||||||||||||
| AtGenExpress* (Hormone) |
248641_at
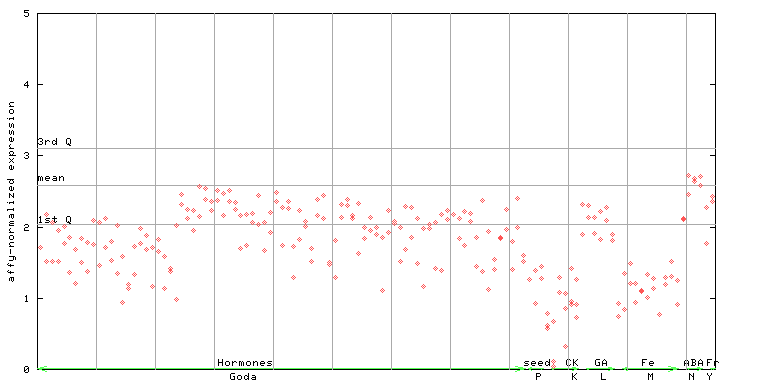
X axis is samples (xls file), and Y axis is log-expression. |
|||||||||||||||||||||||||||||||||||


| Link to other DBs | ||
| Entrez Gene ID | 834970 |
|
| Refseq ID (protein) | NP_001119400.1 | |
| NP_001331415.1 | |
|
| NP_001331416.1 | |
|
| NP_199722.2 | |
|
The preparation time of this page was 0.1 [sec].