[←][→] ath
| functional annotation | ||||||||||||||
| Function | MATE efflux family protein |


|
||||||||||||
| GO BP |
|
|||||||||||||
| GO CC |
|
|||||||||||||
| GO MF |
|
|||||||||||||
| KEGG | ||||||||||||||
| Protein | NP_199724.1 | |||||||||||||
| BLAST | NP_199724.1 | |||||||||||||
| Orthologous | [Ortholog page] LOC7475902 (ppo) LOC25488078 (mtr) LOC100249871 (vvi) LOC100785533 (gma) LOC100787340 (gma) LOC100798616 (gma) LOC100801932 (gma) LOC101258407 (sly) LOC103837275 (bra) LOC103875019 (bra) LOC107276484 (osa) | |||||||||||||
| Subcellular localization wolf |
|
|||||||||||||
| Subcellular localization TargetP |
|
|||||||||||||
| Gene coexpression | ||||||||||||||
| Network*for coexpressed genes |
||||||||||||||
|---|---|---|---|---|---|---|---|---|---|---|---|---|---|---|
| Coexpressed gene list |
[Coexpressed gene list for AT5G49130] | |||||||||||||
| Gene expression | ||||||||||||||
| All samples | [Expression pattern for all samples] | |||||||||||||
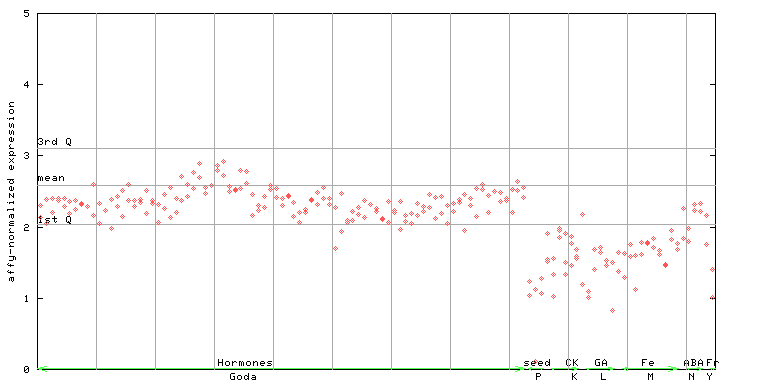
| AtGenExpress* (Development) |
248643_at
X axis is samples (pdf file), and Y axis is log2-expression. |
|||||||||||||
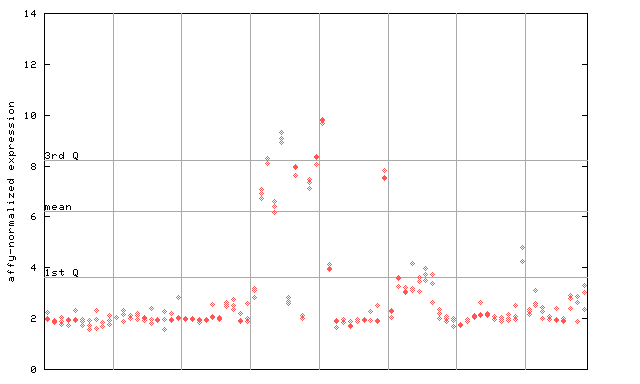
| AtGenExpress* (Stress) |
248643_at
X axis is samples (pdf file), and Y axis is log2-expression. |
|||||||||||||
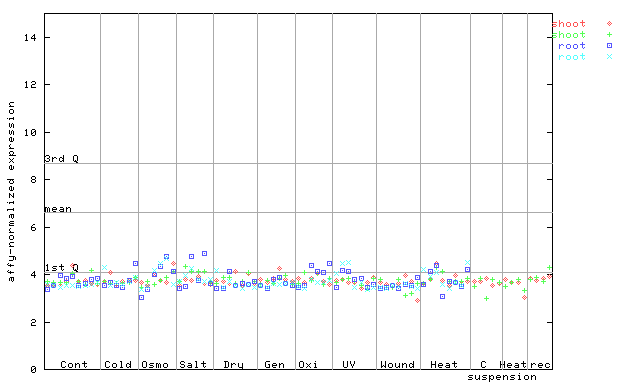
| AtGenExpress* (Hormone) |
248643_at
X axis is samples (xls file), and Y axis is log-expression. |
|||||||||||||

| Link to other DBs | ||
| Entrez Gene ID | 834972 |
|
| Refseq ID (protein) | NP_199724.1 | |
The preparation time of this page was 0.1 [sec].