[←][→] ath
| functional annotation | ||||||||||||||||||||||
| Function | Lactate/malate dehydrogenase family protein |


|
||||||||||||||||||||
| GO BP |
|
|||||||||||||||||||||
| GO CC |
|
|||||||||||||||||||||
| GO MF |
|
|||||||||||||||||||||
| KEGG | ath00020 [list] [network] Citrate cycle (TCA cycle) (63 genes) |  |
||||||||||||||||||||
| ath00270 [list] [network] Cysteine and methionine metabolism (121 genes) | |
|||||||||||||||||||||
| ath00620 [list] [network] Pyruvate metabolism (86 genes) | |
|||||||||||||||||||||
| ath00630 [list] [network] Glyoxylate and dicarboxylate metabolism (78 genes) | |
|||||||||||||||||||||
| ath00710 [list] [network] Carbon fixation in photosynthetic organisms (69 genes) | |
|||||||||||||||||||||
| ath01200 [list] [network] Carbon metabolism (273 genes) | |
|||||||||||||||||||||
| Protein | NP_200483.2 | |||||||||||||||||||||
| BLAST | NP_200483.2 | |||||||||||||||||||||
| Orthologous | [Ortholog page] LOC542598 (zma) LOC547963 (gma) cMDH (sly) c-NAD-MDH2 (ath) c-NAD-MDH1 (ath) LOC4336595 (osa) LOC4348905 (osa) LOC7453937 (ppo) LOC11430390 (mtr) LOC11436578 (mtr) LOC25484448 (mtr) LOC100248145 (vvi) LOC100253273 (vvi) LOC100256452 (vvi) LOC100280767 (zma) LOC100783188 (gma) LOC100811402 (gma) LOC101253131 (sly) LOC103648465 (zma) LOC103836575 (bra) LOC103839246 (bra) LOC103844258 (bra) LOC103845103 (bra) | |||||||||||||||||||||
| Subcellular localization wolf |
|
|||||||||||||||||||||
| Subcellular localization TargetP |
|
|||||||||||||||||||||
| Gene coexpression | ||||||||||||||||||||||
| Network*for coexpressed genes |
||||||||||||||||||||||
|---|---|---|---|---|---|---|---|---|---|---|---|---|---|---|---|---|---|---|---|---|---|---|
| Coexpressed gene list |
[Coexpressed gene list for c-NAD-MDH3] | |||||||||||||||||||||
| Gene expression | ||||||||||||||||||||||
| All samples | [Expression pattern for all samples] | |||||||||||||||||||||
| AtGenExpress* (Development) |
247970_at
X axis is samples (pdf file), and Y axis is log2-expression. |
|||||||||||||||||||||
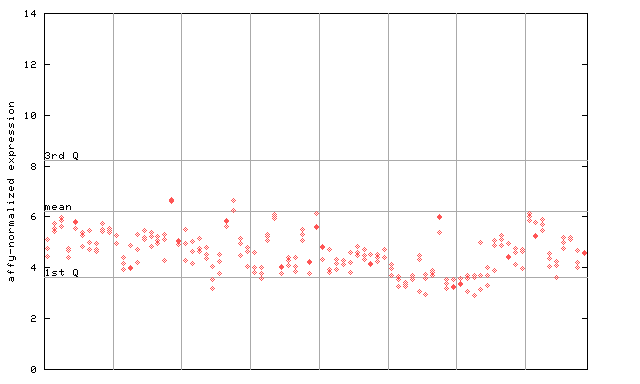
| AtGenExpress* (Stress) |
247970_at
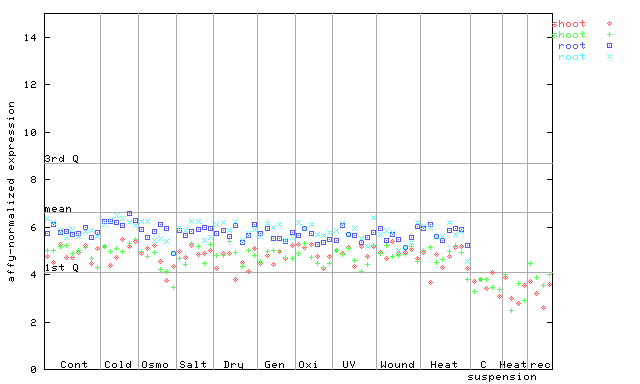
X axis is samples (pdf file), and Y axis is log2-expression. |
|||||||||||||||||||||
| AtGenExpress* (Hormone) |
247970_at
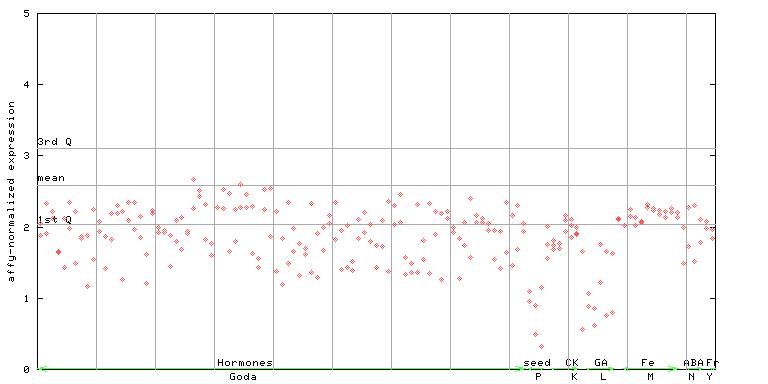
X axis is samples (xls file), and Y axis is log-expression. |
|||||||||||||||||||||

| Link to other DBs | ||
| Entrez Gene ID | 835773 |
|
| Refseq ID (protein) | NP_200483.2 | |
The preparation time of this page was 0.2 [sec].