[←][→] ath
| functional annotation | |||||||||||||||||||||||||||||||||||||||||||||||||||||||||||||||||
| Function | NAD(P)-binding Rossmann-fold superfamily protein |


|
|||||||||||||||||||||||||||||||||||||||||||||||||||||||||||||||
| GO BP |
|
||||||||||||||||||||||||||||||||||||||||||||||||||||||||||||||||
| GO CC |
|
||||||||||||||||||||||||||||||||||||||||||||||||||||||||||||||||
| GO MF |
|
||||||||||||||||||||||||||||||||||||||||||||||||||||||||||||||||
| KEGG | |||||||||||||||||||||||||||||||||||||||||||||||||||||||||||||||||
| Protein | NP_200657.1 | ||||||||||||||||||||||||||||||||||||||||||||||||||||||||||||||||
| BLAST | NP_200657.1 | ||||||||||||||||||||||||||||||||||||||||||||||||||||||||||||||||
| Orthologous | [Ortholog page] LOC4327527 (osa) LOC4334578 (osa) LOC7478788 (ppo) LOC11407110 (mtr) LOC11410793 (mtr) LOC100137082 (gma) LOC100191263 (zma) LOC100253488 (vvi) LOC100283001 (zma) LOC100800492 (gma) LOC100803241 (gma) LOC100806281 (gma) LOC101250958 (sly) LOC103651053 (zma) LOC103845276 (bra) | ||||||||||||||||||||||||||||||||||||||||||||||||||||||||||||||||
| Subcellular localization wolf |
|
||||||||||||||||||||||||||||||||||||||||||||||||||||||||||||||||
| Subcellular localization TargetP |
|
||||||||||||||||||||||||||||||||||||||||||||||||||||||||||||||||
| Gene coexpression | |||||||||||||||||||||||||||||||||||||||||||||||||||||||||||||||||
| Network*for coexpressed genes |
|
||||||||||||||||||||||||||||||||||||||||||||||||||||||||||||||||
|---|---|---|---|---|---|---|---|---|---|---|---|---|---|---|---|---|---|---|---|---|---|---|---|---|---|---|---|---|---|---|---|---|---|---|---|---|---|---|---|---|---|---|---|---|---|---|---|---|---|---|---|---|---|---|---|---|---|---|---|---|---|---|---|---|---|
| Coexpressed gene list |
[Coexpressed gene list for AT5G58490] | ||||||||||||||||||||||||||||||||||||||||||||||||||||||||||||||||
| Gene expression | |||||||||||||||||||||||||||||||||||||||||||||||||||||||||||||||||
| All samples | [Expression pattern for all samples] | ||||||||||||||||||||||||||||||||||||||||||||||||||||||||||||||||
| AtGenExpress* (Development) |
247834_at
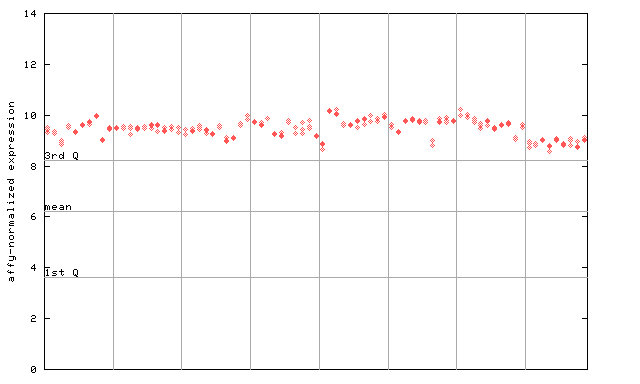
X axis is samples (pdf file), and Y axis is log2-expression. |
||||||||||||||||||||||||||||||||||||||||||||||||||||||||||||||||
| AtGenExpress* (Stress) |
247834_at
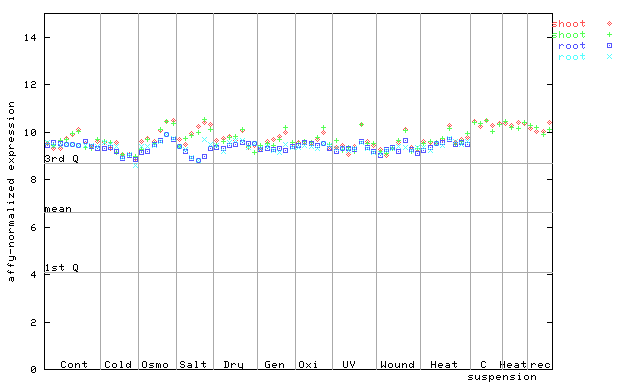
X axis is samples (pdf file), and Y axis is log2-expression. |
||||||||||||||||||||||||||||||||||||||||||||||||||||||||||||||||
| AtGenExpress* (Hormone) |
247834_at
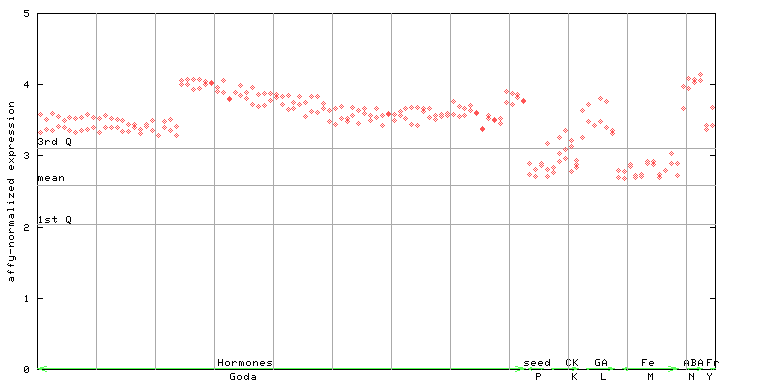
X axis is samples (xls file), and Y axis is log-expression. |
||||||||||||||||||||||||||||||||||||||||||||||||||||||||||||||||


")
")
")
")
")
| Link to other DBs | ||
| Entrez Gene ID | 835962 |
|
| Refseq ID (protein) | NP_200657.1 | |
The preparation time of this page was 0.2 [sec].