[←][→] ath
| functional annotation | |||||||||||||||||||||||||||||||||||||||
| Function | K-stimulated pyrophosphate-energized sodium pump protein |


|
|||||||||||||||||||||||||||||||||||||
| GO BP |
|
||||||||||||||||||||||||||||||||||||||
| GO CC |
|
||||||||||||||||||||||||||||||||||||||
| GO MF |
|
||||||||||||||||||||||||||||||||||||||
| KEGG | |||||||||||||||||||||||||||||||||||||||
| Protein | NP_001330619.1 NP_001330620.1 NP_568917.1 | ||||||||||||||||||||||||||||||||||||||
| BLAST | NP_001330619.1 NP_001330620.1 NP_568917.1 | ||||||||||||||||||||||||||||||||||||||
| Orthologous | [Ortholog page] LOC4324527 (osa) LOC7485719 (ppo) LOC11410183 (mtr) LOC100260346 (vvi) LOC100276061 (zma) LOC100775283 (gma) LOC100815374 (gma) LOC101266600 (sly) LOC103845415 (bra) | ||||||||||||||||||||||||||||||||||||||
| Subcellular localization wolf |
|
||||||||||||||||||||||||||||||||||||||
| Subcellular localization TargetP |
|
||||||||||||||||||||||||||||||||||||||
| Gene coexpression | |||||||||||||||||||||||||||||||||||||||
| Network*for coexpressed genes |
|
||||||||||||||||||||||||||||||||||||||
|---|---|---|---|---|---|---|---|---|---|---|---|---|---|---|---|---|---|---|---|---|---|---|---|---|---|---|---|---|---|---|---|---|---|---|---|---|---|---|---|
| Coexpressed gene list |
[Coexpressed gene list for AT5G59960] | ||||||||||||||||||||||||||||||||||||||
| Gene expression | |||||||||||||||||||||||||||||||||||||||
| All samples | [Expression pattern for all samples] | ||||||||||||||||||||||||||||||||||||||
| AtGenExpress* (Development) |
247650_at
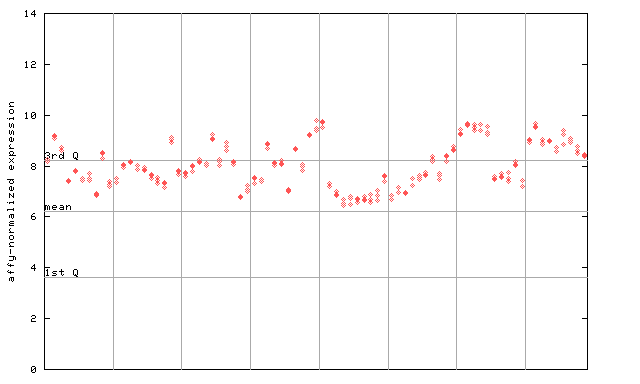
X axis is samples (pdf file), and Y axis is log2-expression. |
||||||||||||||||||||||||||||||||||||||
| AtGenExpress* (Stress) |
247650_at
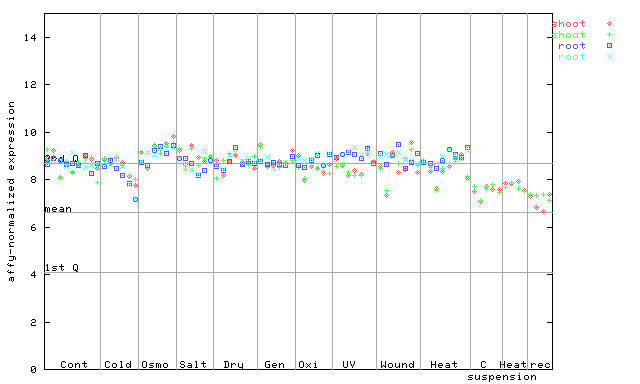
X axis is samples (pdf file), and Y axis is log2-expression. |
||||||||||||||||||||||||||||||||||||||
| AtGenExpress* (Hormone) |
247650_at
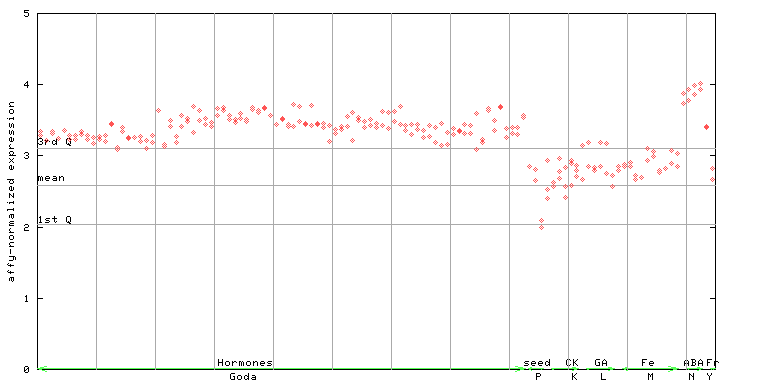
X axis is samples (xls file), and Y axis is log-expression. |
||||||||||||||||||||||||||||||||||||||


")
| Link to other DBs | ||
| Entrez Gene ID | 836118 |
|
| Refseq ID (protein) | NP_001330619.1 | |
| NP_001330620.1 | |
|
| NP_568917.1 | |
|
The preparation time of this page was 0.1 [sec].