[←][→] ath
| functional annotation | ||||||||||||||||||||||||||||||||||||||
| Function | histidine acid phosphatase family protein |


|
||||||||||||||||||||||||||||||||||||
| GO BP |
|
|||||||||||||||||||||||||||||||||||||
| GO CC |
|
|||||||||||||||||||||||||||||||||||||
| GO MF |
|
|||||||||||||||||||||||||||||||||||||
| KEGG | ath00010 [list] [network] Glycolysis / Gluconeogenesis (116 genes) |  |
||||||||||||||||||||||||||||||||||||
| ath00562 [list] [network] Inositol phosphate metabolism (77 genes) | |
|||||||||||||||||||||||||||||||||||||
| Protein | NP_563856.1 | |||||||||||||||||||||||||||||||||||||
| BLAST | NP_563856.1 | |||||||||||||||||||||||||||||||||||||
| Orthologous | [Ortholog page] LOC4334577 (osa) LOC7462092 (ppo) LOC11415895 (mtr) LOC100248519 (vvi) LOC100253622 (vvi) LOC100282868 (zma) PAP02 (gma) LOC100815749 (gma) LOC101244492 (sly) LOC101260052 (sly) LOC103843331 (bra) LOC103871767 (bra) | |||||||||||||||||||||||||||||||||||||
| Subcellular localization wolf |
|
|||||||||||||||||||||||||||||||||||||
| Subcellular localization TargetP |
|
|||||||||||||||||||||||||||||||||||||
| Gene coexpression | ||||||||||||||||||||||||||||||||||||||
| Network*for coexpressed genes |
|
|||||||||||||||||||||||||||||||||||||
|---|---|---|---|---|---|---|---|---|---|---|---|---|---|---|---|---|---|---|---|---|---|---|---|---|---|---|---|---|---|---|---|---|---|---|---|---|---|---|
| Coexpressed gene list |
[Coexpressed gene list for AT1G09870] | |||||||||||||||||||||||||||||||||||||
| Gene expression | ||||||||||||||||||||||||||||||||||||||
| All samples | [Expression pattern for all samples] | |||||||||||||||||||||||||||||||||||||
| AtGenExpress* (Development) |
264676_at
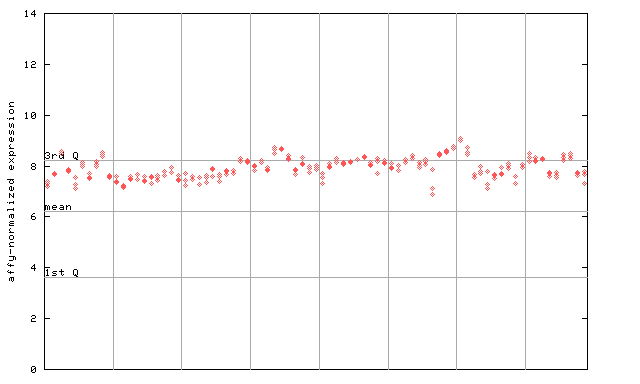
X axis is samples (pdf file), and Y axis is log2-expression. |
|||||||||||||||||||||||||||||||||||||
| AtGenExpress* (Stress) |
264676_at
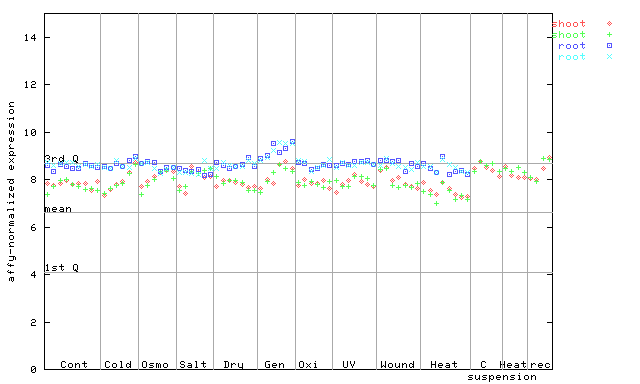
X axis is samples (pdf file), and Y axis is log2-expression. |
|||||||||||||||||||||||||||||||||||||
| AtGenExpress* (Hormone) |
264676_at
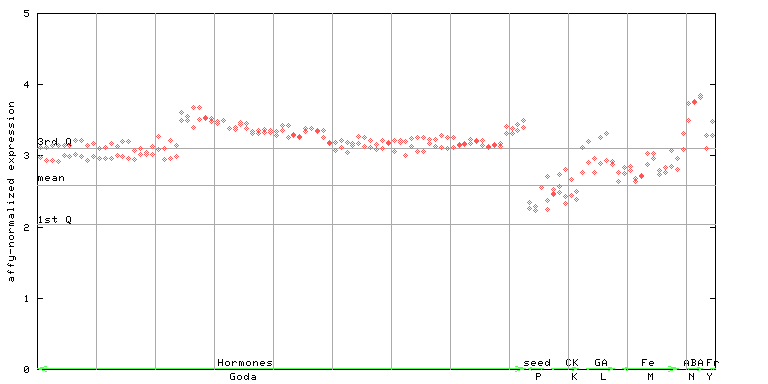
X axis is samples (xls file), and Y axis is log-expression. |
|||||||||||||||||||||||||||||||||||||


")
")
| Link to other DBs | ||
| Entrez Gene ID | 837519 |
|
| Refseq ID (protein) | NP_563856.1 | |
The preparation time of this page was 0.2 [sec].