[←][→] ath
| functional annotation | ||||||||||||||||||||||||||||||||||||
| Function | Nucleotide-sugar transporter family protein |


|
||||||||||||||||||||||||||||||||||
| GO BP |
|
|||||||||||||||||||||||||||||||||||
| GO CC |
|
|||||||||||||||||||||||||||||||||||
| GO MF |
|
|||||||||||||||||||||||||||||||||||
| KEGG | ||||||||||||||||||||||||||||||||||||
| Protein | NP_172712.1 | |||||||||||||||||||||||||||||||||||
| BLAST | NP_172712.1 | |||||||||||||||||||||||||||||||||||
| Orthologous | [Ortholog page] LOC7478092 (ppo) LOC11410697 (mtr) LOC100266779 (vvi) LOC100795794 (gma) LOC100813464 (gma) LOC101256613 (sly) LOC103836159 (bra) LOC103871996 (bra) | |||||||||||||||||||||||||||||||||||
| Subcellular localization wolf |
|
|||||||||||||||||||||||||||||||||||
| Subcellular localization TargetP |
|
|||||||||||||||||||||||||||||||||||
| Gene coexpression | ||||||||||||||||||||||||||||||||||||
| Network*for coexpressed genes |
|
|||||||||||||||||||||||||||||||||||
|---|---|---|---|---|---|---|---|---|---|---|---|---|---|---|---|---|---|---|---|---|---|---|---|---|---|---|---|---|---|---|---|---|---|---|---|---|
| Coexpressed gene list |
[Coexpressed gene list for AT1G12500] | |||||||||||||||||||||||||||||||||||
| Gene expression | ||||||||||||||||||||||||||||||||||||
| All samples | [Expression pattern for all samples] | |||||||||||||||||||||||||||||||||||
| AtGenExpress* (Development) |
259523_at
X axis is samples (pdf file), and Y axis is log2-expression. |
|||||||||||||||||||||||||||||||||||
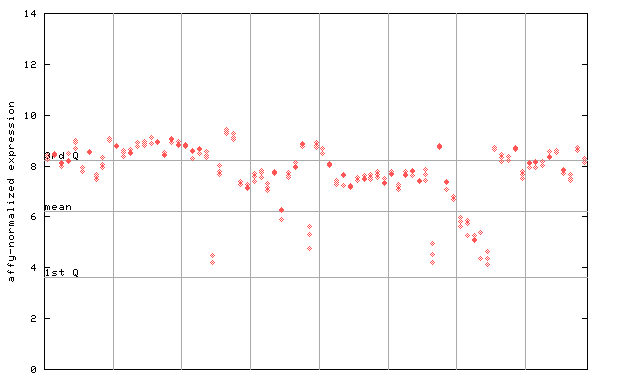
| AtGenExpress* (Stress) |
259523_at
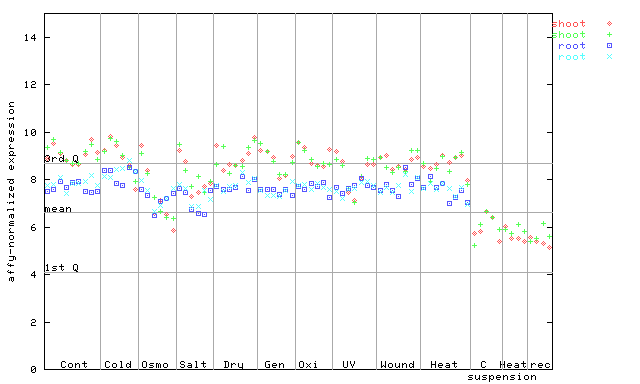
X axis is samples (pdf file), and Y axis is log2-expression. |
|||||||||||||||||||||||||||||||||||
| AtGenExpress* (Hormone) |
259523_at
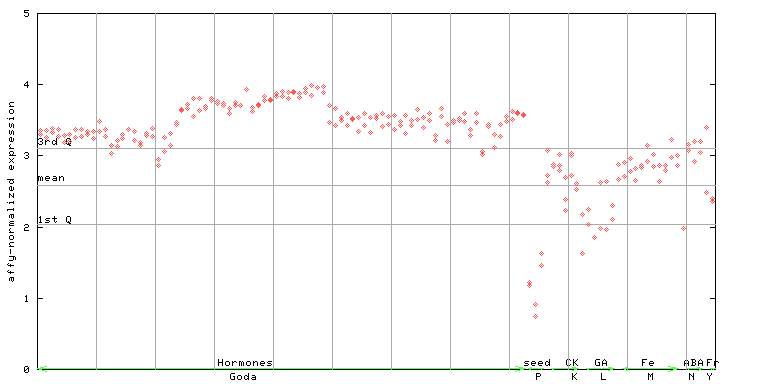
X axis is samples (xls file), and Y axis is log-expression. |
|||||||||||||||||||||||||||||||||||


| Link to other DBs | ||
| Entrez Gene ID | 837807 |
|
| Refseq ID (protein) | NP_172712.1 | |
The preparation time of this page was 0.2 [sec].