[←][→] ath
| functional annotation | ||||||||||||||
| Function | UDP-N-acetylglucosamine (UAA) transporter family |


|
||||||||||||
| GO BP |
|
|||||||||||||
| GO CC |
|
|||||||||||||
| GO MF |
|
|||||||||||||
| KEGG | ||||||||||||||
| Protein | NP_172720.1 | |||||||||||||
| BLAST | NP_172720.1 | |||||||||||||
| Orthologous | [Ortholog page] UTR2 (ath) LOC4331414 (osa) LOC7478076 (ppo) LOC7496932 (ppo) LOC11426703 (mtr) LOC100242001 (vvi) LOC100256411 (vvi) LOC100778968 (gma) LOC100791781 (gma) LOC101247050 (sly) LOC101264861 (sly) LOC103639606 (zma) LOC103836154 (bra) LOC103860707 (bra) LOC103861351 (bra) | |||||||||||||
| Subcellular localization wolf |
|
|||||||||||||
| Subcellular localization TargetP |
|
|||||||||||||
| Gene coexpression | ||||||||||||||
| Network*for coexpressed genes |
||||||||||||||
|---|---|---|---|---|---|---|---|---|---|---|---|---|---|---|
| Coexpressed gene list |
[Coexpressed gene list for AT1G12600] | |||||||||||||
| Gene expression | ||||||||||||||
| All samples | [Expression pattern for all samples] | |||||||||||||
| AtGenExpress* (Development) |
259527_at
X axis is samples (pdf file), and Y axis is log2-expression. |
|||||||||||||
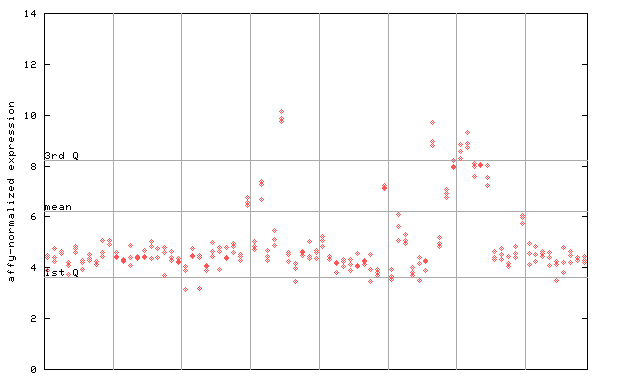
| AtGenExpress* (Stress) |
259527_at
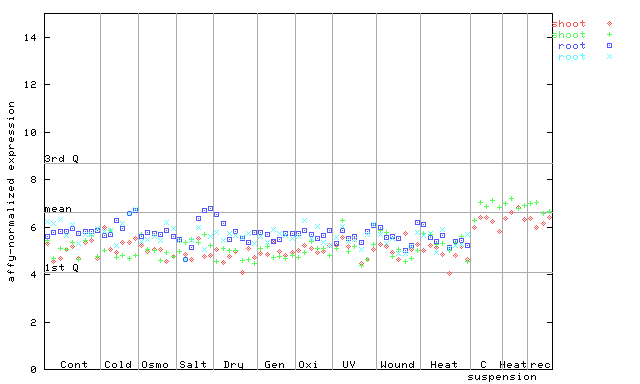
X axis is samples (pdf file), and Y axis is log2-expression. |
|||||||||||||
| AtGenExpress* (Hormone) |
259527_at
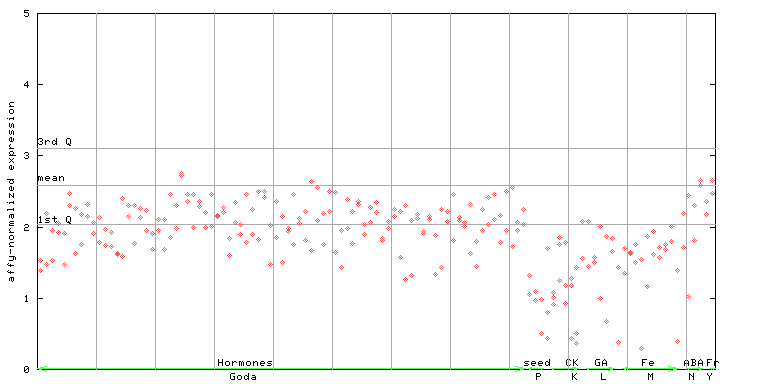
X axis is samples (xls file), and Y axis is log-expression. |
|||||||||||||

| Link to other DBs | ||
| Entrez Gene ID | 837816 |
|
| Refseq ID (protein) | NP_172720.1 | |
The preparation time of this page was 0.2 [sec].