[←][→] ath
| functional annotation | |||||||||||||||||||||||||||||||||||||||||||
| Function | DNA ligase-like protein |


|
|||||||||||||||||||||||||||||||||||||||||
| GO BP |
|
||||||||||||||||||||||||||||||||||||||||||
| GO CC |
|
||||||||||||||||||||||||||||||||||||||||||
| GO MF |
|
||||||||||||||||||||||||||||||||||||||||||
| KEGG | |||||||||||||||||||||||||||||||||||||||||||
| Protein | NP_563913.1 | ||||||||||||||||||||||||||||||||||||||||||
| BLAST | NP_563913.1 | ||||||||||||||||||||||||||||||||||||||||||
| Orthologous | [Ortholog page] LOC4339770 (osa) LOC7459110 (ppo) LOC11424226 (mtr) LOC100253283 (vvi) LOC100780115 (gma) LOC100786486 (gma) LOC101260831 (sly) LOC103635416 (zma) LOC103871981 (bra) | ||||||||||||||||||||||||||||||||||||||||||
| Subcellular localization wolf |
|
||||||||||||||||||||||||||||||||||||||||||
| Subcellular localization TargetP |
|
||||||||||||||||||||||||||||||||||||||||||
| Gene coexpression | |||||||||||||||||||||||||||||||||||||||||||
| Network*for coexpressed genes |
|
||||||||||||||||||||||||||||||||||||||||||
|---|---|---|---|---|---|---|---|---|---|---|---|---|---|---|---|---|---|---|---|---|---|---|---|---|---|---|---|---|---|---|---|---|---|---|---|---|---|---|---|---|---|---|---|
| Coexpressed gene list |
[Coexpressed gene list for AT1G12790] | ||||||||||||||||||||||||||||||||||||||||||
| Gene expression | |||||||||||||||||||||||||||||||||||||||||||
| All samples | [Expression pattern for all samples] | ||||||||||||||||||||||||||||||||||||||||||
| AtGenExpress* (Development) |
261205_at
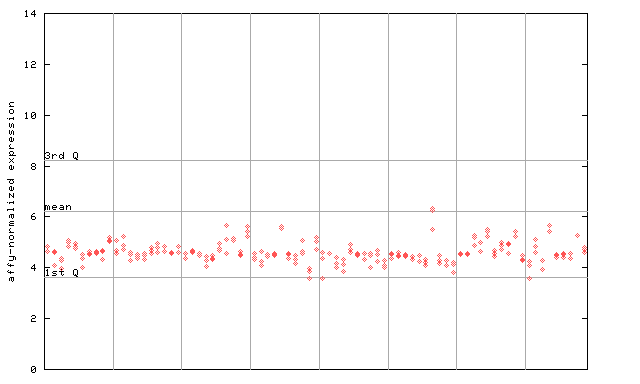
X axis is samples (pdf file), and Y axis is log2-expression. |
||||||||||||||||||||||||||||||||||||||||||
| AtGenExpress* (Stress) |
261205_at
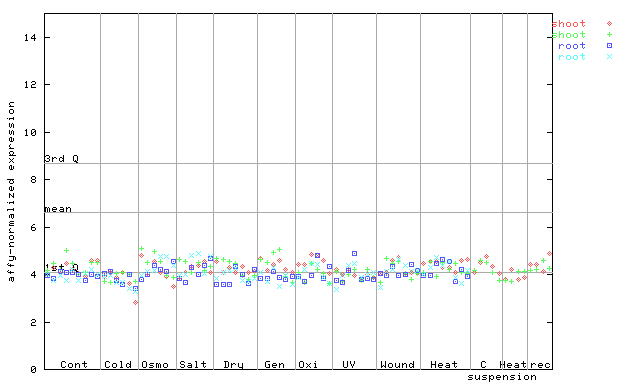
X axis is samples (pdf file), and Y axis is log2-expression. |
||||||||||||||||||||||||||||||||||||||||||
| AtGenExpress* (Hormone) |
261205_at
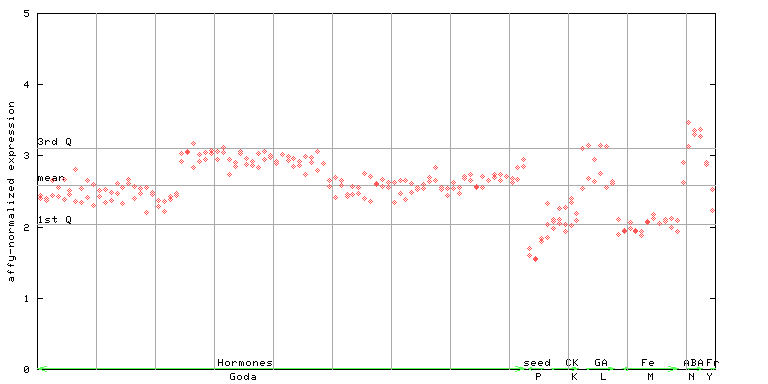
X axis is samples (xls file), and Y axis is log-expression. |
||||||||||||||||||||||||||||||||||||||||||


")
")
| Link to other DBs | ||
| Entrez Gene ID | 837835 |
|
| Refseq ID (protein) | NP_563913.1 | |
The preparation time of this page was 0.1 [sec].