[←][→] ath
| functional annotation | ||||||||||||||||||||||||||
| Function | transmembrane protein |


|
||||||||||||||||||||||||
| GO BP |
|
|||||||||||||||||||||||||
| GO CC |
|
|||||||||||||||||||||||||
| GO MF |
|
|||||||||||||||||||||||||
| KEGG | ||||||||||||||||||||||||||
| Protein | NP_001184998.1 NP_172952.2 | |||||||||||||||||||||||||
| BLAST | NP_001184998.1 NP_172952.2 | |||||||||||||||||||||||||
| Orthologous | [Ortholog page] LOC7475529 (ppo) LOC7488401 (ppo) LOC9268014 (osa) LOC25484190 (mtr) LOC100193445 (zma) LOC100262974 (vvi) LOC100306456 (gma) LOC100788088 (gma) LOC101262711 (sly) LOC103842927 (bra) LOC103872290 (bra) | |||||||||||||||||||||||||
| Subcellular localization wolf |
|
|||||||||||||||||||||||||
| Subcellular localization TargetP |
|
|||||||||||||||||||||||||
| Gene coexpression | ||||||||||||||||||||||||||
| Network*for coexpressed genes |
|
|||||||||||||||||||||||||
|---|---|---|---|---|---|---|---|---|---|---|---|---|---|---|---|---|---|---|---|---|---|---|---|---|---|---|
| Coexpressed gene list |
[Coexpressed gene list for AT1G14990] | |||||||||||||||||||||||||
| Gene expression | ||||||||||||||||||||||||||
| All samples | [Expression pattern for all samples] | |||||||||||||||||||||||||
| AtGenExpress* (Development) |
260738_at
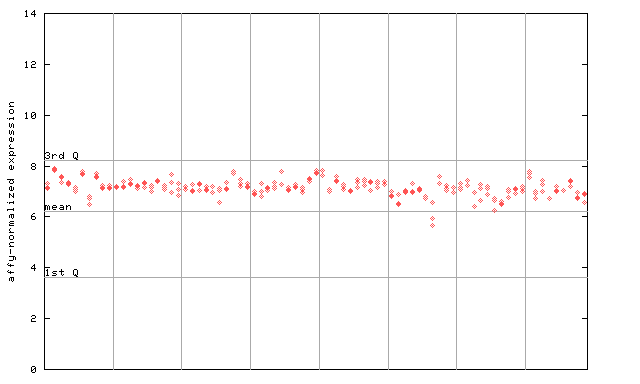
X axis is samples (pdf file), and Y axis is log2-expression. |
|||||||||||||||||||||||||
| AtGenExpress* (Stress) |
260738_at
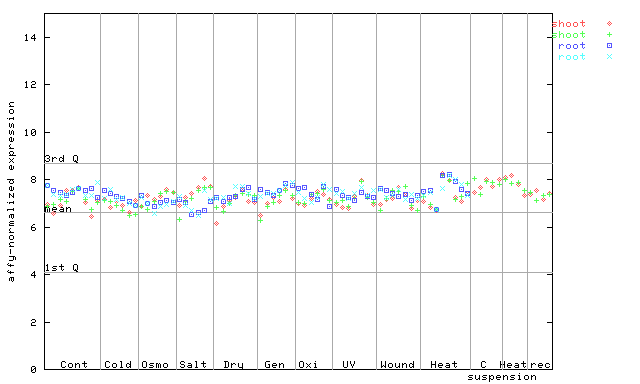
X axis is samples (pdf file), and Y axis is log2-expression. |
|||||||||||||||||||||||||
| AtGenExpress* (Hormone) |
260738_at
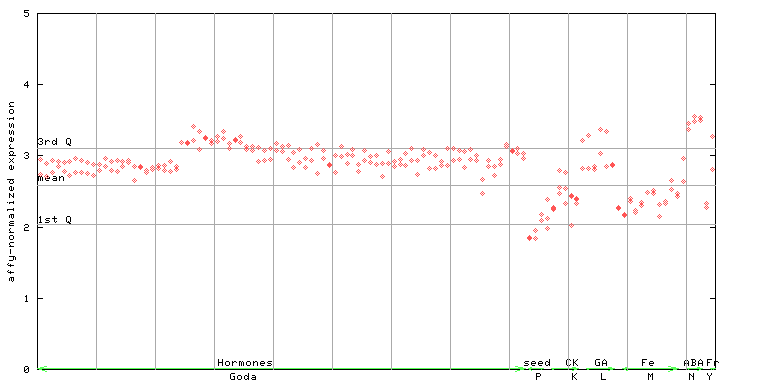
X axis is samples (xls file), and Y axis is log-expression. |
|||||||||||||||||||||||||


| Link to other DBs | ||
| Entrez Gene ID | 838064 |
|
| Refseq ID (protein) | NP_001184998.1 | |
| NP_172952.2 | |
|
The preparation time of this page was 0.2 [sec].