[←][→] ath
| functional annotation | ||||||||||||||||||||||||||||||||||||||||||||
| Function | FAD/NAD(P)-binding oxidoreductase |


|
||||||||||||||||||||||||||||||||||||||||||
| GO BP |
|
|||||||||||||||||||||||||||||||||||||||||||
| GO CC |
|
|||||||||||||||||||||||||||||||||||||||||||
| GO MF |
|
|||||||||||||||||||||||||||||||||||||||||||
| KEGG | ||||||||||||||||||||||||||||||||||||||||||||
| Protein | NP_563963.1 NP_973832.1 NP_973833.1 | |||||||||||||||||||||||||||||||||||||||||||
| BLAST | NP_563963.1 NP_973832.1 NP_973833.1 | |||||||||||||||||||||||||||||||||||||||||||
| Orthologous | [Ortholog page] LOC4329197 (osa) LOC7459800 (ppo) LOC11445499 (mtr) LOC100255949 (vvi) LOC100282665 (zma) LOC100790250 (gma) LOC100796877 (gma) LOC101262213 (sly) LOC103836043 (bra) LOC103872626 (bra) | |||||||||||||||||||||||||||||||||||||||||||
| Subcellular localization wolf |
|
|||||||||||||||||||||||||||||||||||||||||||
| Subcellular localization TargetP |
|
|||||||||||||||||||||||||||||||||||||||||||
| Gene coexpression | ||||||||||||||||||||||||||||||||||||||||||||
| Network*for coexpressed genes |
|
|||||||||||||||||||||||||||||||||||||||||||
|---|---|---|---|---|---|---|---|---|---|---|---|---|---|---|---|---|---|---|---|---|---|---|---|---|---|---|---|---|---|---|---|---|---|---|---|---|---|---|---|---|---|---|---|---|
| Coexpressed gene list |
[Coexpressed gene list for AT1G15140] | |||||||||||||||||||||||||||||||||||||||||||
| Gene expression | ||||||||||||||||||||||||||||||||||||||||||||
| All samples | [Expression pattern for all samples] | |||||||||||||||||||||||||||||||||||||||||||
| AtGenExpress* (Development) |
262572_at
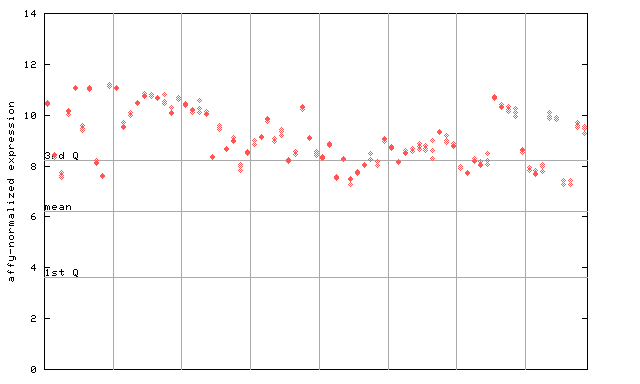
X axis is samples (pdf file), and Y axis is log2-expression. |
|||||||||||||||||||||||||||||||||||||||||||
| AtGenExpress* (Stress) |
262572_at
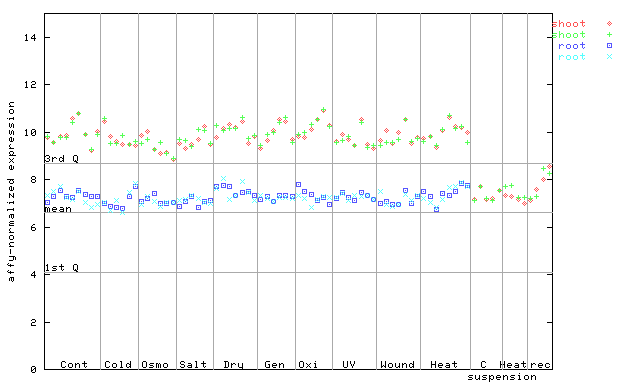
X axis is samples (pdf file), and Y axis is log2-expression. |
|||||||||||||||||||||||||||||||||||||||||||
| AtGenExpress* (Hormone) |
262572_at
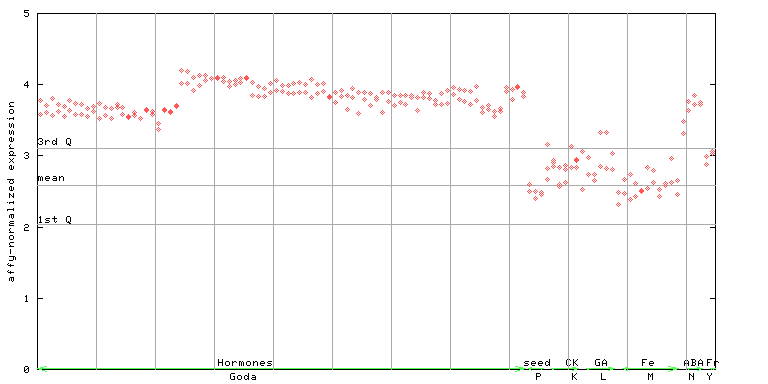
X axis is samples (xls file), and Y axis is log-expression. |
|||||||||||||||||||||||||||||||||||||||||||


")
| Link to other DBs | ||
| Entrez Gene ID | 838079 |
|
| Refseq ID (protein) | NP_563963.1 | |
| NP_973832.1 | |
|
| NP_973833.1 | |
|
The preparation time of this page was 0.1 [sec].