[←][→] ath
| functional annotation | ||||||||||||||||||||||||||||||||||||||
| Function | organic cation/carnitine transporter 6 |


|
||||||||||||||||||||||||||||||||||||
| GO BP |
|
|||||||||||||||||||||||||||||||||||||
| GO CC |
|
|||||||||||||||||||||||||||||||||||||
| GO MF |
|
|||||||||||||||||||||||||||||||||||||
| KEGG | ||||||||||||||||||||||||||||||||||||||
| Protein | NP_173087.1 | |||||||||||||||||||||||||||||||||||||
| BLAST | NP_173087.1 | |||||||||||||||||||||||||||||||||||||
| Orthologous | [Ortholog page] OCT5 (ath) LOC103830486 (bra) LOC103832417 (bra) LOC103872426 (bra) LOC103872427 (bra) | |||||||||||||||||||||||||||||||||||||
| Subcellular localization wolf |
|
|||||||||||||||||||||||||||||||||||||
| Subcellular localization TargetP |
|
|||||||||||||||||||||||||||||||||||||
| Gene coexpression | ||||||||||||||||||||||||||||||||||||||
| Network*for coexpressed genes |
|
|||||||||||||||||||||||||||||||||||||
|---|---|---|---|---|---|---|---|---|---|---|---|---|---|---|---|---|---|---|---|---|---|---|---|---|---|---|---|---|---|---|---|---|---|---|---|---|---|---|
| Coexpressed gene list |
[Coexpressed gene list for OCT6] | |||||||||||||||||||||||||||||||||||||
| Gene expression | ||||||||||||||||||||||||||||||||||||||
| All samples | [Expression pattern for all samples] | |||||||||||||||||||||||||||||||||||||
| AtGenExpress* (Development) |
262756_at
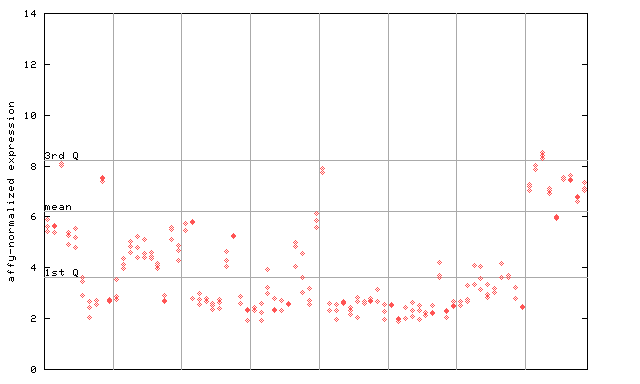
X axis is samples (pdf file), and Y axis is log2-expression. |
|||||||||||||||||||||||||||||||||||||
| AtGenExpress* (Stress) |
262756_at
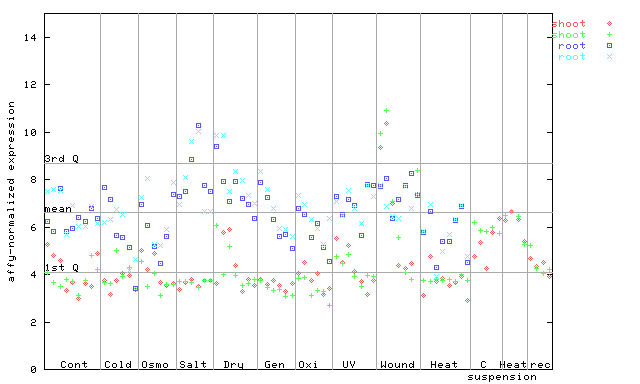
X axis is samples (pdf file), and Y axis is log2-expression. |
|||||||||||||||||||||||||||||||||||||
| AtGenExpress* (Hormone) |
262756_at
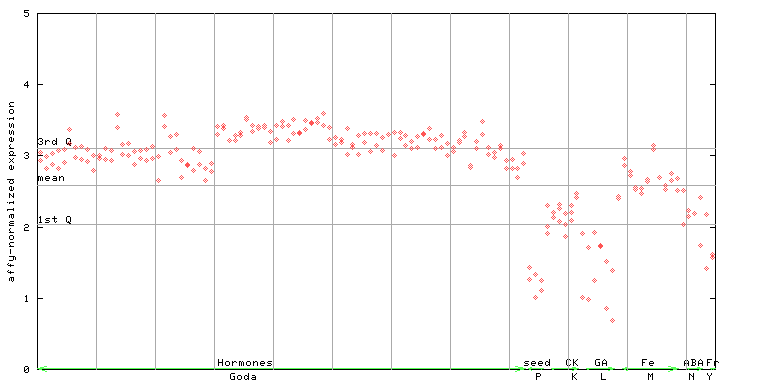
X axis is samples (xls file), and Y axis is log-expression. |
|||||||||||||||||||||||||||||||||||||


")
")
| Link to other DBs | ||
| Entrez Gene ID | 838207 |
|
| Refseq ID (protein) | NP_173087.1 | |
The preparation time of this page was 0.2 [sec].