[←][→] ath
| functional annotation | ||||||||
| Function | p300/CBP acetyltransferase-related protein-like protein |


|
||||||
| GO BP |
|
|||||||
| GO CC |
|
|||||||
| GO MF |
|
|||||||
| KEGG | ||||||||
| Protein | NP_001031059.1 NP_001320493.1 NP_564004.1 | |||||||
| BLAST | NP_001031059.1 NP_001320493.1 NP_564004.1 | |||||||
| Orthologous | [Ortholog page] LOC25498858 (mtr) LOC25499443 (mtr) LOC103835991 (bra) LOC103835993 (bra) LOC103842835 (bra) LOC103842837 (bra) | |||||||
| Subcellular localization wolf |
|
|||||||
| Subcellular localization TargetP |
|
|||||||
| Gene coexpression | ||||||||
| Network*for coexpressed genes |
||||||||
|---|---|---|---|---|---|---|---|---|
| Coexpressed gene list |
[Coexpressed gene list for AT1G16705] | |||||||
| Gene expression | ||||||||
| All samples | [Expression pattern for all samples] | |||||||
| AtGenExpress* (Development) |
255768_at
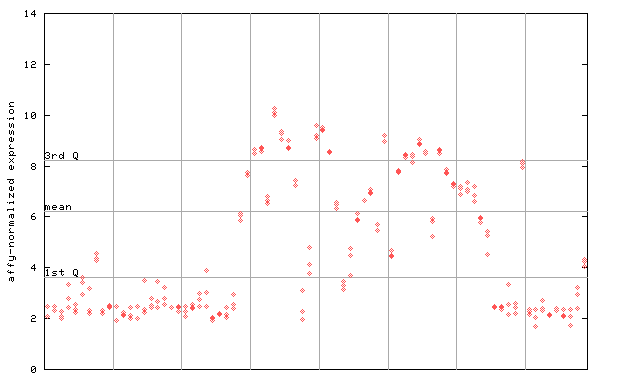
X axis is samples (pdf file), and Y axis is log2-expression. |
|||||||
| AtGenExpress* (Stress) |
255768_at
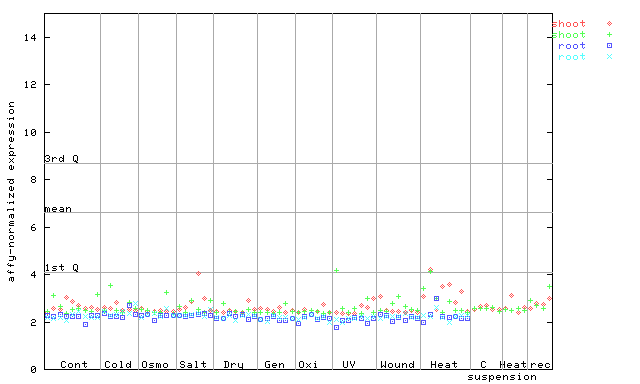
X axis is samples (pdf file), and Y axis is log2-expression. |
|||||||
| AtGenExpress* (Hormone) |
255768_at
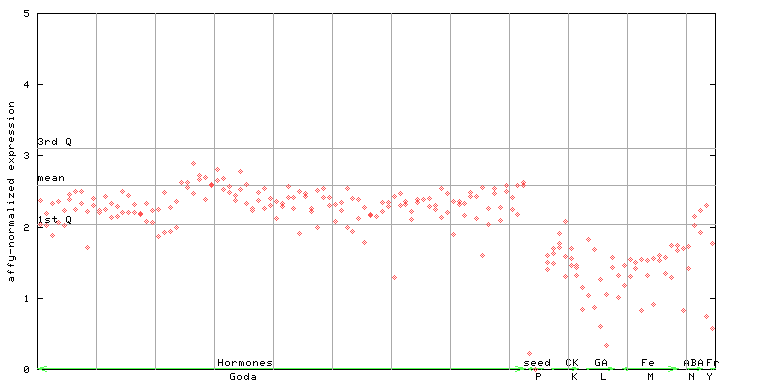
X axis is samples (xls file), and Y axis is log-expression. |
|||||||

| Link to other DBs | ||
| Entrez Gene ID | 838241 |
|
| Refseq ID (protein) | NP_001031059.1 | |
| NP_001320493.1 | |
|
| NP_564004.1 | |
|
The preparation time of this page was 0.1 [sec].