[←][→] ath
| functional annotation | ||||||||||||||
| Function | O-fucosyltransferase family protein |


|
||||||||||||
| GO BP |
|
|||||||||||||
| GO CC |
|
|||||||||||||
| GO MF |
|
|||||||||||||
| KEGG | ||||||||||||||
| Protein | NP_173662.2 | |||||||||||||
| BLAST | NP_173662.2 | |||||||||||||
| Orthologous | [Ortholog page] LOC4340507 (osa) LOC7467179 (ppo) LOC7468885 (ppo) LOC11433671 (mtr) LOC11434669 (mtr) LOC100193572 (zma) LOC100267809 (vvi) LOC100775284 (gma) LOC100795727 (gma) LOC100800040 (gma) LOC100807411 (gma) LOC101264514 (sly) LOC103869049 (bra) | |||||||||||||
| Subcellular localization wolf |
|
|||||||||||||
| Subcellular localization TargetP |
|
|||||||||||||
| Gene coexpression | ||||||||||||||
| Network*for coexpressed genes |
||||||||||||||
|---|---|---|---|---|---|---|---|---|---|---|---|---|---|---|
| Coexpressed gene list |
[Coexpressed gene list for AT1G22460] | |||||||||||||
| Gene expression | ||||||||||||||
| All samples | [Expression pattern for all samples] | |||||||||||||
| AtGenExpress* (Development) |
261929_at
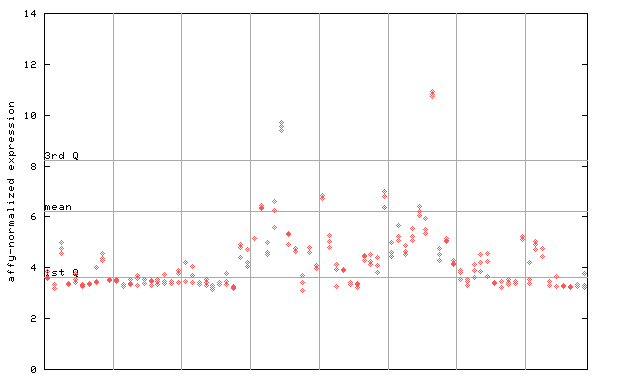
X axis is samples (pdf file), and Y axis is log2-expression. |
|||||||||||||
| AtGenExpress* (Stress) |
261929_at
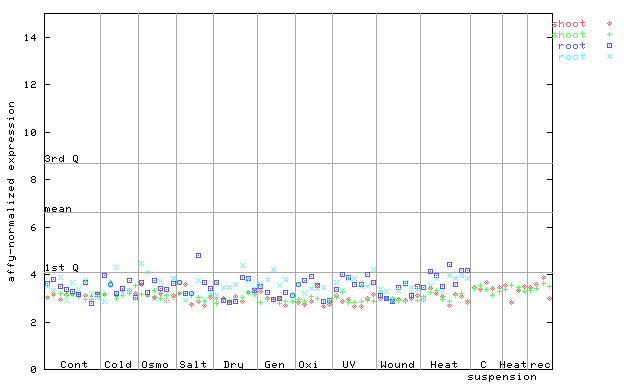
X axis is samples (pdf file), and Y axis is log2-expression. |
|||||||||||||
| AtGenExpress* (Hormone) |
261929_at
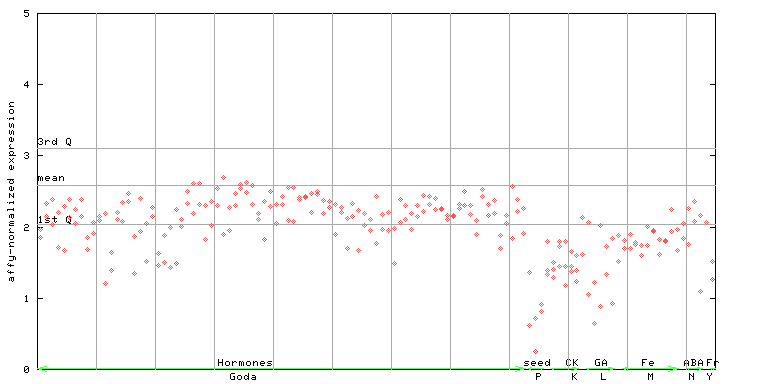
X axis is samples (xls file), and Y axis is log-expression. |
|||||||||||||

| Link to other DBs | ||
| Entrez Gene ID | 838852 |
|
| Refseq ID (protein) | NP_173662.2 | |
The preparation time of this page was 0.1 [sec].