[←][→] ath
| functional annotation | ||||||||||||||||||||||||||
| Function | nitrate transporter 1.6 |


|
||||||||||||||||||||||||
| GO BP |
|
|||||||||||||||||||||||||
| GO CC |
|
|||||||||||||||||||||||||
| GO MF |
|
|||||||||||||||||||||||||
| KEGG | ||||||||||||||||||||||||||
| Protein | NP_001321840.1 NP_174028.2 | |||||||||||||||||||||||||
| BLAST | NP_001321840.1 NP_174028.2 | |||||||||||||||||||||||||
| Orthologous | [Ortholog page] NRT1.7 (ath) LOC4324322 (osa) LOC11422634 (mtr) LOC25502812 (mtr) LOC100250071 (vvi) LOC100776472 (gma) LOC100809657 (gma) LOC100815154 (gma) LOC101254689 (sly) LOC103829221 (bra) LOC103829831 (bra) LOC103831529 (bra) LOC103852618 (bra) | |||||||||||||||||||||||||
| Subcellular localization wolf |
|
|||||||||||||||||||||||||
| Subcellular localization TargetP |
|
|||||||||||||||||||||||||
| Gene coexpression | ||||||||||||||||||||||||||
| Network*for coexpressed genes |
||||||||||||||||||||||||||
|---|---|---|---|---|---|---|---|---|---|---|---|---|---|---|---|---|---|---|---|---|---|---|---|---|---|---|
| Coexpressed gene list |
[Coexpressed gene list for NRT1.6] | |||||||||||||||||||||||||
| Gene expression | ||||||||||||||||||||||||||
| All samples | [Expression pattern for all samples] | |||||||||||||||||||||||||
| AtGenExpress* (Development) |
264976_at
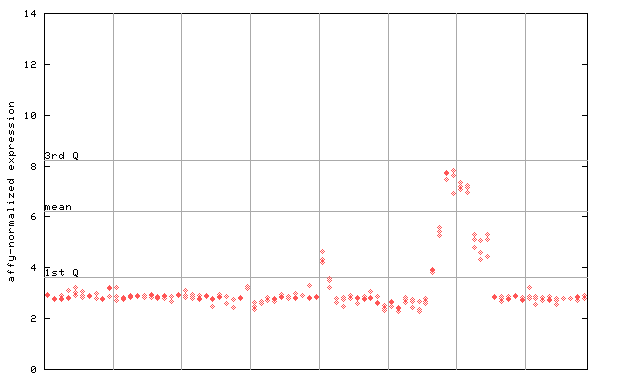
X axis is samples (pdf file), and Y axis is log2-expression. |
|||||||||||||||||||||||||
| AtGenExpress* (Stress) |
264976_at
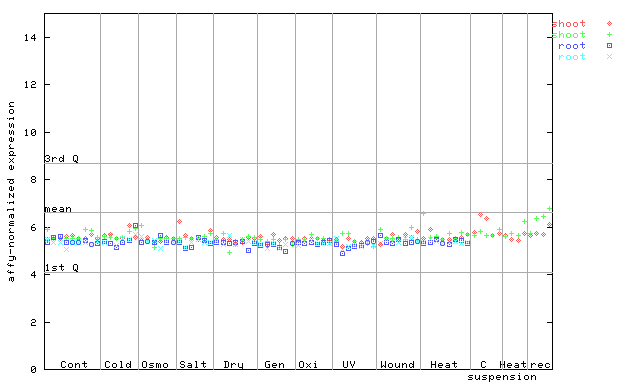
X axis is samples (pdf file), and Y axis is log2-expression. |
|||||||||||||||||||||||||
| AtGenExpress* (Hormone) |
264976_at
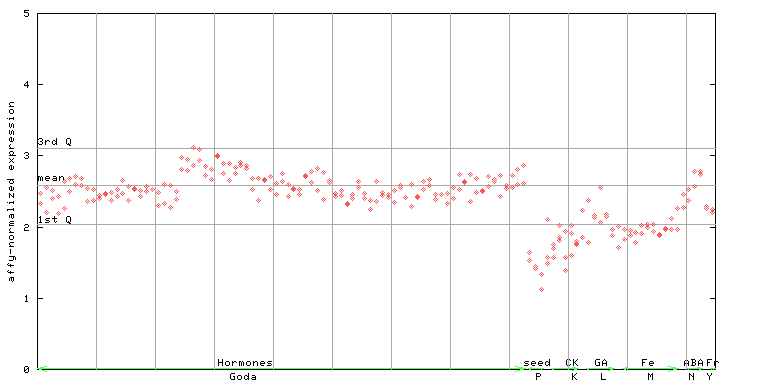
X axis is samples (xls file), and Y axis is log-expression. |
|||||||||||||||||||||||||

| Link to other DBs | ||
| Entrez Gene ID | 839597 |
|
| Refseq ID (protein) | NP_001321840.1 | |
| NP_174028.2 | |
|
The preparation time of this page was 0.1 [sec].