[←][→] ath
| functional annotation | |||||||||||||||||||||||||||||||||||||||||||
| Function | hypothetical protein |


|
|||||||||||||||||||||||||||||||||||||||||
| GO BP |
|
||||||||||||||||||||||||||||||||||||||||||
| GO CC |
|
||||||||||||||||||||||||||||||||||||||||||
| GO MF |
|
||||||||||||||||||||||||||||||||||||||||||
| KEGG | |||||||||||||||||||||||||||||||||||||||||||
| Protein | NP_564283.1 | ||||||||||||||||||||||||||||||||||||||||||
| BLAST | NP_564283.1 | ||||||||||||||||||||||||||||||||||||||||||
| Orthologous | [Ortholog page] LOC4352204 (osa) LOC7495811 (ppo) LOC25489469 (mtr) LOC100264285 (vvi) LOC100384299 (zma) LOC100804262 (gma) LOC101264851 (sly) LOC103835397 (bra) | ||||||||||||||||||||||||||||||||||||||||||
| Subcellular localization wolf |
|
||||||||||||||||||||||||||||||||||||||||||
| Subcellular localization TargetP |
|
||||||||||||||||||||||||||||||||||||||||||
| Gene coexpression | |||||||||||||||||||||||||||||||||||||||||||
| Network*for coexpressed genes |
|
||||||||||||||||||||||||||||||||||||||||||
|---|---|---|---|---|---|---|---|---|---|---|---|---|---|---|---|---|---|---|---|---|---|---|---|---|---|---|---|---|---|---|---|---|---|---|---|---|---|---|---|---|---|---|---|
| Coexpressed gene list |
[Coexpressed gene list for AT1G27435] | ||||||||||||||||||||||||||||||||||||||||||
| Gene expression | |||||||||||||||||||||||||||||||||||||||||||
| All samples | [Expression pattern for all samples] | ||||||||||||||||||||||||||||||||||||||||||
| AtGenExpress* (Development) |
264441_at
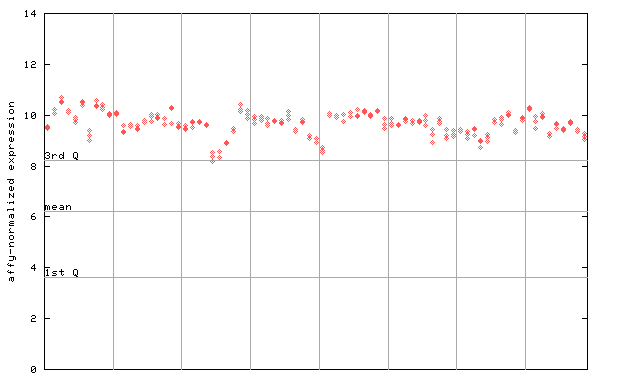
X axis is samples (pdf file), and Y axis is log2-expression. |
||||||||||||||||||||||||||||||||||||||||||
| AtGenExpress* (Stress) |
264441_at
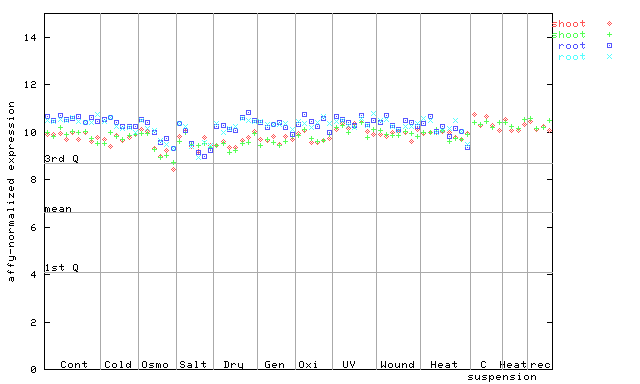
X axis is samples (pdf file), and Y axis is log2-expression. |
||||||||||||||||||||||||||||||||||||||||||
| AtGenExpress* (Hormone) |
264441_at
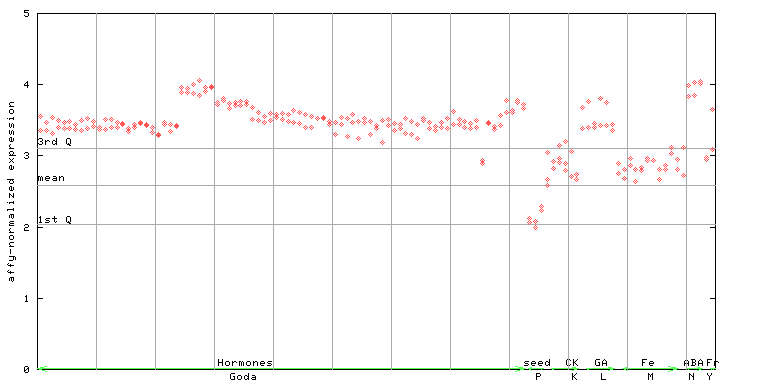
X axis is samples (xls file), and Y axis is log-expression. |
||||||||||||||||||||||||||||||||||||||||||


")
")
| Link to other DBs | ||
| Entrez Gene ID | 839634 |
|
| Refseq ID (protein) | NP_564283.1 | |
The preparation time of this page was 0.2 [sec].