[←][→] ath
| functional annotation | ||||||||||||||||||||||||||||||||||
| Function | no pollen germination related 1 |


|
||||||||||||||||||||||||||||||||
| GO BP |
|
|||||||||||||||||||||||||||||||||
| GO CC |
|
|||||||||||||||||||||||||||||||||
| GO MF |
|
|||||||||||||||||||||||||||||||||
| KEGG | ||||||||||||||||||||||||||||||||||
| Protein | NP_001321148.1 NP_001321149.1 NP_564285.1 | |||||||||||||||||||||||||||||||||
| BLAST | NP_001321148.1 NP_001321149.1 NP_564285.1 | |||||||||||||||||||||||||||||||||
| Orthologous | [Ortholog page] LOC4331967 (osa) LOC7488867 (ppo) LOC11417191 (mtr) LOC100216592 (zma) LOC100241952 (vvi) LOC100780807 (gma) LOC100795958 (gma) LOC100799086 (gma) LOC100799251 (gma) LOC101258948 (sly) LOC103835393 (bra) | |||||||||||||||||||||||||||||||||
| Subcellular localization wolf |
|
|||||||||||||||||||||||||||||||||
| Subcellular localization TargetP |
|
|||||||||||||||||||||||||||||||||
| Gene coexpression | ||||||||||||||||||||||||||||||||||
| Network*for coexpressed genes |
|
|||||||||||||||||||||||||||||||||
|---|---|---|---|---|---|---|---|---|---|---|---|---|---|---|---|---|---|---|---|---|---|---|---|---|---|---|---|---|---|---|---|---|---|---|
| Coexpressed gene list |
[Coexpressed gene list for NPGR1] | |||||||||||||||||||||||||||||||||
| Gene expression | ||||||||||||||||||||||||||||||||||
| All samples | [Expression pattern for all samples] | |||||||||||||||||||||||||||||||||
| AtGenExpress* (Development) |
264449_at
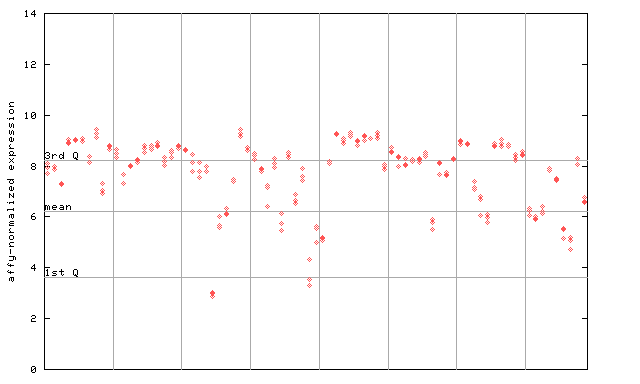
X axis is samples (pdf file), and Y axis is log2-expression. |
|||||||||||||||||||||||||||||||||
| AtGenExpress* (Stress) |
264449_at
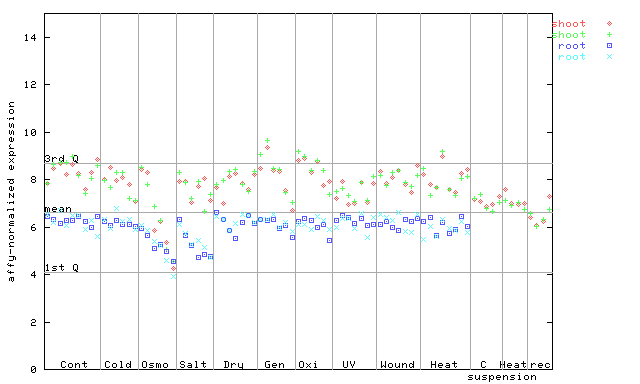
X axis is samples (pdf file), and Y axis is log2-expression. |
|||||||||||||||||||||||||||||||||
| AtGenExpress* (Hormone) |
264449_at
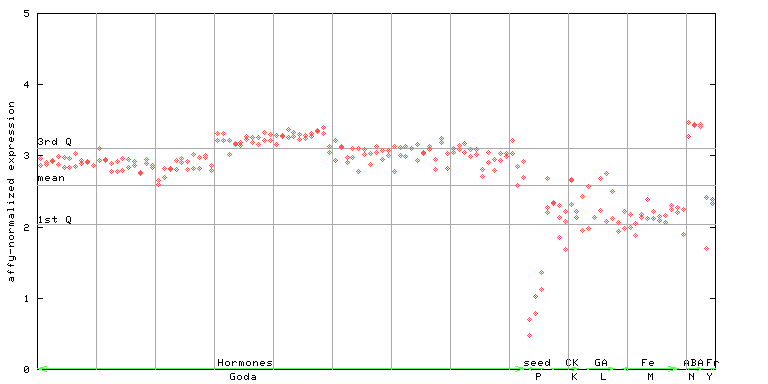
X axis is samples (xls file), and Y axis is log-expression. |
|||||||||||||||||||||||||||||||||


")
| Link to other DBs | ||
| Entrez Gene ID | 839637 |
|
| Refseq ID (protein) | NP_001321148.1 | |
| NP_001321149.1 | |
|
| NP_564285.1 | |
|
The preparation time of this page was 0.2 [sec].