[←][→] ath
| functional annotation | ||||||||||||||||||||||||||||||||||
| Function | RING/U-box superfamily protein |


|
||||||||||||||||||||||||||||||||
| GO BP |
|
|||||||||||||||||||||||||||||||||
| GO CC |
|
|||||||||||||||||||||||||||||||||
| GO MF |
|
|||||||||||||||||||||||||||||||||
| KEGG | ||||||||||||||||||||||||||||||||||
| Protein | NP_174371.2 | |||||||||||||||||||||||||||||||||
| BLAST | NP_174371.2 | |||||||||||||||||||||||||||||||||
| Orthologous | [Ortholog page] EDA18 (ath) LOC25488200 (mtr) LOC25493454 (mtr) LOC100253105 (vvi) LOC100278771 (zma) LOC100796627 (gma) LOC100796661 (gma) LOC101246285 (sly) LOC101246588 (sly) LOC103833423 (bra) LOC103840284 (bra) LOC103865364 (bra) LOC103867406 (bra) | |||||||||||||||||||||||||||||||||
| Subcellular localization wolf |
|
|||||||||||||||||||||||||||||||||
| Subcellular localization TargetP |
|
|||||||||||||||||||||||||||||||||
| Gene coexpression | ||||||||||||||||||||||||||||||||||
| Network*for coexpressed genes |
|
|||||||||||||||||||||||||||||||||
|---|---|---|---|---|---|---|---|---|---|---|---|---|---|---|---|---|---|---|---|---|---|---|---|---|---|---|---|---|---|---|---|---|---|---|
| Coexpressed gene list |
[Coexpressed gene list for AT1G30860] | |||||||||||||||||||||||||||||||||
| Gene expression | ||||||||||||||||||||||||||||||||||
| All samples | [Expression pattern for all samples] | |||||||||||||||||||||||||||||||||
| AtGenExpress* (Development) |
265128_at
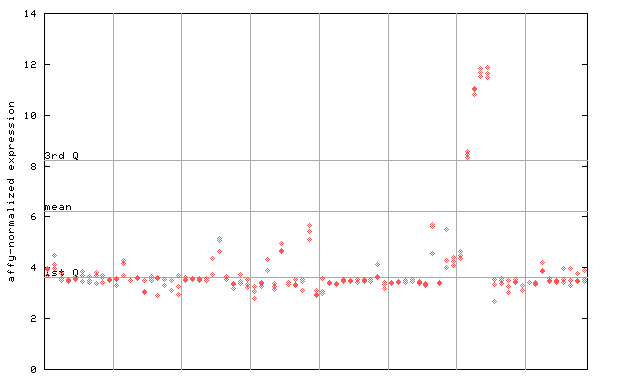
X axis is samples (pdf file), and Y axis is log2-expression. |
|||||||||||||||||||||||||||||||||
| AtGenExpress* (Stress) |
265128_at
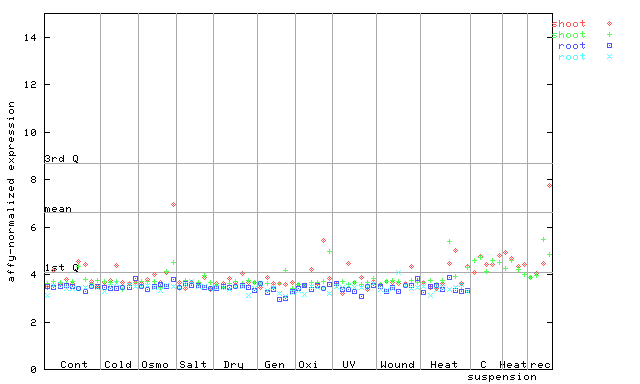
X axis is samples (pdf file), and Y axis is log2-expression. |
|||||||||||||||||||||||||||||||||
| AtGenExpress* (Hormone) |
265128_at
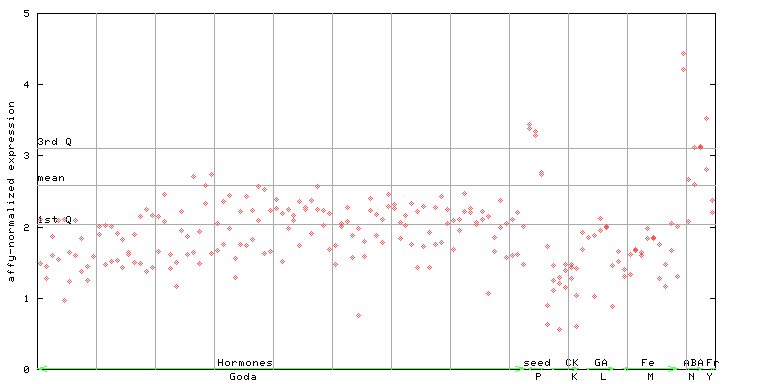
X axis is samples (xls file), and Y axis is log-expression. |
|||||||||||||||||||||||||||||||||


")
| Link to other DBs | ||
| Entrez Gene ID | 839970 |
|
| Refseq ID (protein) | NP_174371.2 | |
The preparation time of this page was 0.2 [sec].