[←][→] ath
| functional annotation | ||||||||||||||||||||||||||||||||||
| Function | RNA helicase family protein |


|
||||||||||||||||||||||||||||||||
| GO BP |
|
|||||||||||||||||||||||||||||||||
| GO CC |
|
|||||||||||||||||||||||||||||||||
| GO MF |
|
|||||||||||||||||||||||||||||||||
| KEGG | ath03040 [list] [network] Spliceosome (192 genes) |  |
||||||||||||||||||||||||||||||||
| Protein | NP_001185127.1 NP_174527.2 | |||||||||||||||||||||||||||||||||
| BLAST | NP_001185127.1 NP_174527.2 | |||||||||||||||||||||||||||||||||
| Orthologous | [Ortholog page] MEE29 (ath) AT4G16680 (ath) LOC4345304 (osa) LOC25488674 (mtr) LOC100244993 (vvi) LOC100383864 (zma) LOC100809559 (gma) LOC101265017 (sly) LOC103869316 (bra) LOC103874751 (bra) | |||||||||||||||||||||||||||||||||
| Subcellular localization wolf |
|
|||||||||||||||||||||||||||||||||
| Subcellular localization TargetP |
|
|||||||||||||||||||||||||||||||||
| Gene coexpression | ||||||||||||||||||||||||||||||||||
| Network*for coexpressed genes |
|
|||||||||||||||||||||||||||||||||
|---|---|---|---|---|---|---|---|---|---|---|---|---|---|---|---|---|---|---|---|---|---|---|---|---|---|---|---|---|---|---|---|---|---|---|
| Coexpressed gene list |
[Coexpressed gene list for ESP3] | |||||||||||||||||||||||||||||||||
| Gene expression | ||||||||||||||||||||||||||||||||||
| All samples | [Expression pattern for all samples] | |||||||||||||||||||||||||||||||||
| AtGenExpress* (Development) |
260695_at
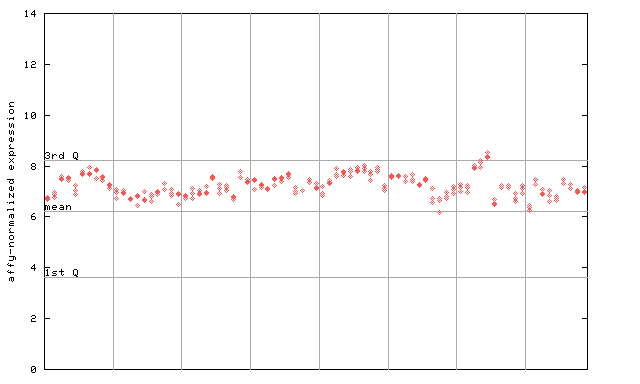
X axis is samples (pdf file), and Y axis is log2-expression. |
|||||||||||||||||||||||||||||||||
| AtGenExpress* (Stress) |
260695_at
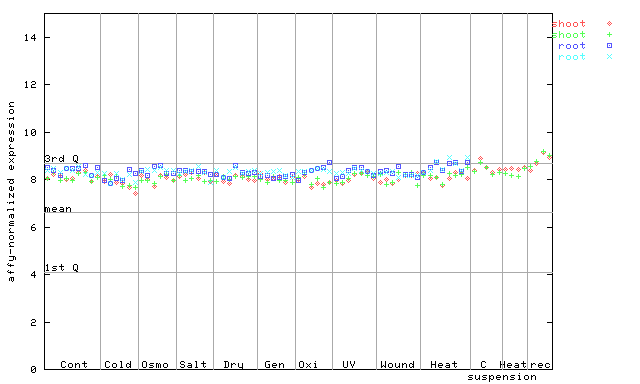
X axis is samples (pdf file), and Y axis is log2-expression. |
|||||||||||||||||||||||||||||||||
| AtGenExpress* (Hormone) |
260695_at
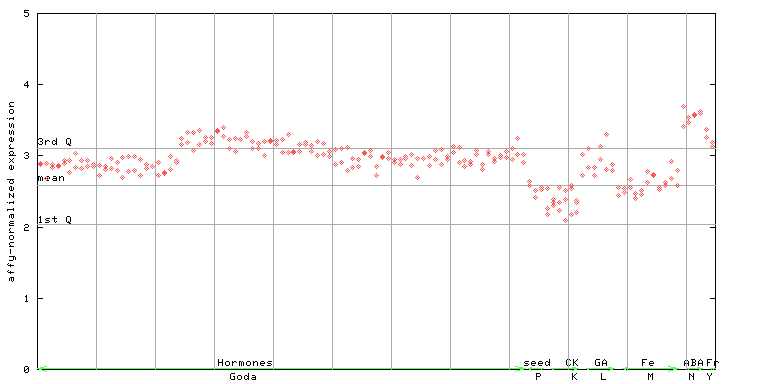
X axis is samples (xls file), and Y axis is log-expression. |
|||||||||||||||||||||||||||||||||


")
| Link to other DBs | ||
| Entrez Gene ID | 840143 |
|
| Refseq ID (protein) | NP_001185127.1 | |
| NP_174527.2 | |
|
The preparation time of this page was 0.4 [sec].