[←][→] ath
| functional annotation | ||||||||||||||||||||||||||||||||||||
| Function | NAC domain containing protein 15 |


|
||||||||||||||||||||||||||||||||||
| GO BP |
|
|||||||||||||||||||||||||||||||||||
| GO CC |
|
|||||||||||||||||||||||||||||||||||
| GO MF |
|
|||||||||||||||||||||||||||||||||||
| KEGG | ||||||||||||||||||||||||||||||||||||
| Protein | NP_174598.1 | |||||||||||||||||||||||||||||||||||
| BLAST | NP_174598.1 | |||||||||||||||||||||||||||||||||||
| Orthologous | [Ortholog page] NAC070 (ath) LOC11434735 (mtr) LOC100248262 (vvi) LOC100285286 (zma) LOC100775746 (gma) NAC171 (gma) LOC101261423 (sly) LOC103646413 (zma) LOC103838908 (bra) LOC103858562 (bra) LOC107280688 (osa) | |||||||||||||||||||||||||||||||||||
| Subcellular localization wolf |
|
|||||||||||||||||||||||||||||||||||
| Subcellular localization TargetP |
|
|||||||||||||||||||||||||||||||||||
| Gene coexpression | ||||||||||||||||||||||||||||||||||||
| Network*for coexpressed genes |
|
|||||||||||||||||||||||||||||||||||
|---|---|---|---|---|---|---|---|---|---|---|---|---|---|---|---|---|---|---|---|---|---|---|---|---|---|---|---|---|---|---|---|---|---|---|---|---|
| Coexpressed gene list |
[Coexpressed gene list for NAC015] | |||||||||||||||||||||||||||||||||||
| Gene expression | ||||||||||||||||||||||||||||||||||||
| All samples | [Expression pattern for all samples] | |||||||||||||||||||||||||||||||||||
| AtGenExpress* (Development) |
256535_at
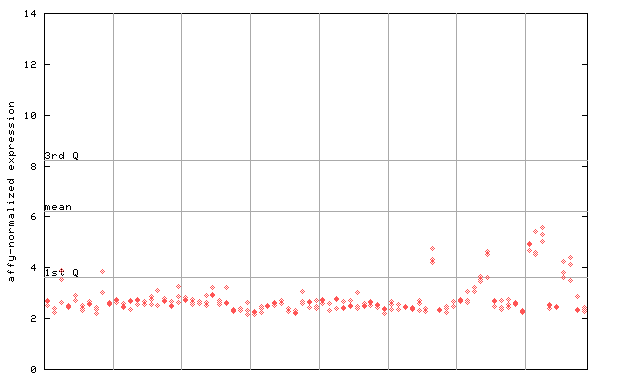
X axis is samples (pdf file), and Y axis is log2-expression. |
|||||||||||||||||||||||||||||||||||
| AtGenExpress* (Stress) |
256535_at
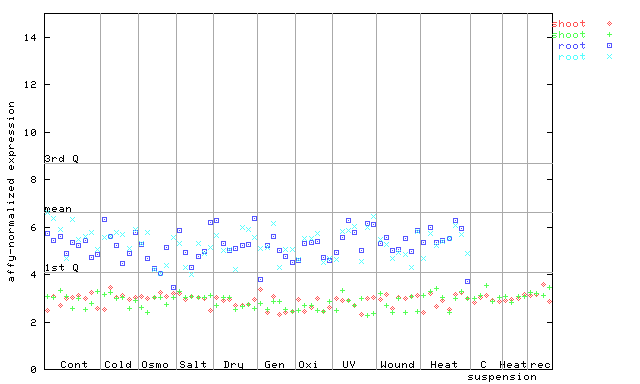
X axis is samples (pdf file), and Y axis is log2-expression. |
|||||||||||||||||||||||||||||||||||
| AtGenExpress* (Hormone) |
256535_at
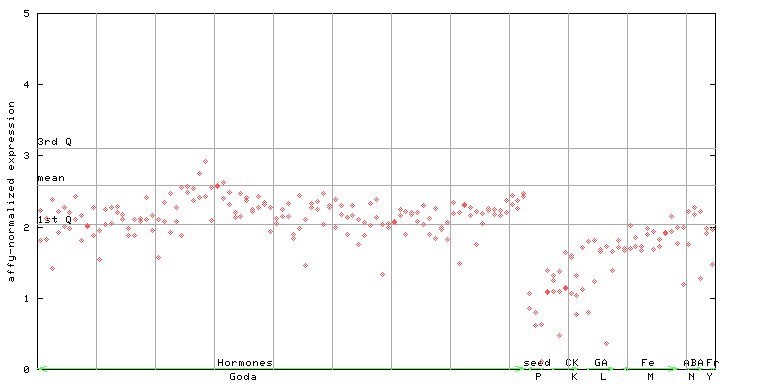
X axis is samples (xls file), and Y axis is log-expression. |
|||||||||||||||||||||||||||||||||||


| Link to other DBs | ||
| Entrez Gene ID | 840223 |
|
| Refseq ID (protein) | NP_174598.1 | |
The preparation time of this page was 0.2 [sec].