[←][→] ath
| functional annotation | ||||||||||||||||||||||||||||||||||
| Function | FORMS APLOID AND BINUCLEATE CELLS 1A |


|
||||||||||||||||||||||||||||||||
| GO BP |
|
|||||||||||||||||||||||||||||||||
| GO CC |
|
|||||||||||||||||||||||||||||||||
| GO MF |
|
|||||||||||||||||||||||||||||||||
| KEGG | ath00562 [list] [network] Inositol phosphate metabolism (77 genes) |  |
||||||||||||||||||||||||||||||||
| ath04070 [list] [network] Phosphatidylinositol signaling system (76 genes) | |
|||||||||||||||||||||||||||||||||
| ath04145 [list] [network] Phagosome (82 genes) | |
|||||||||||||||||||||||||||||||||
| Protein | NP_001319143.1 NP_001321919.1 NP_001321920.1 NP_174686.1 | |||||||||||||||||||||||||||||||||
| BLAST | NP_001319143.1 NP_001321919.1 NP_001321920.1 NP_174686.1 | |||||||||||||||||||||||||||||||||
| Orthologous | [Ortholog page] LOC4337509 (osa) LOC4344440 (osa) LOC25485003 (mtr) LOC100242669 (vvi) LOC100809696 (gma) LOC100815340 (gma) LOC101252196 (sly) LOC101259601 (sly) LOC103628939 (zma) LOC103646184 (zma) LOC103653169 (zma) LOC103840013 (bra) | |||||||||||||||||||||||||||||||||
| Subcellular localization wolf |
|
|||||||||||||||||||||||||||||||||
| Subcellular localization TargetP |
|
|||||||||||||||||||||||||||||||||
| Gene coexpression | ||||||||||||||||||||||||||||||||||
| Network*for coexpressed genes |
|
|||||||||||||||||||||||||||||||||
|---|---|---|---|---|---|---|---|---|---|---|---|---|---|---|---|---|---|---|---|---|---|---|---|---|---|---|---|---|---|---|---|---|---|---|
| Coexpressed gene list |
[Coexpressed gene list for FAB1D] | |||||||||||||||||||||||||||||||||
| Gene expression | ||||||||||||||||||||||||||||||||||
| All samples | [Expression pattern for all samples] | |||||||||||||||||||||||||||||||||
| AtGenExpress* (Development) |
262540_at
X axis is samples (pdf file), and Y axis is log2-expression. |
|||||||||||||||||||||||||||||||||
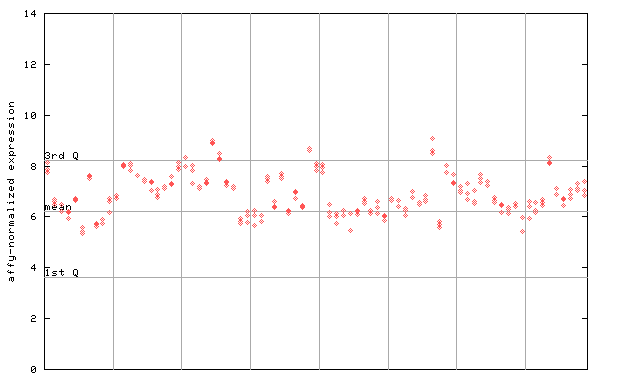
| AtGenExpress* (Stress) |
262540_at
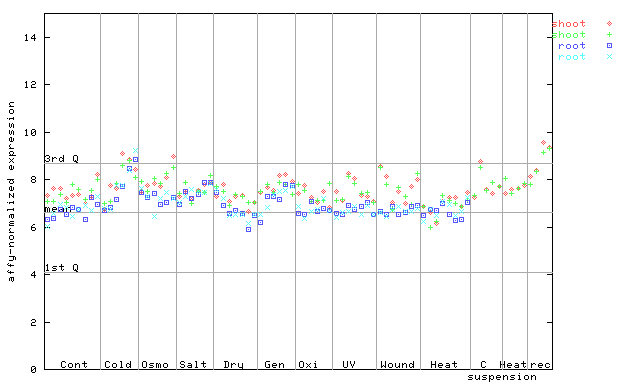
X axis is samples (pdf file), and Y axis is log2-expression. |
|||||||||||||||||||||||||||||||||
| AtGenExpress* (Hormone) |
262540_at
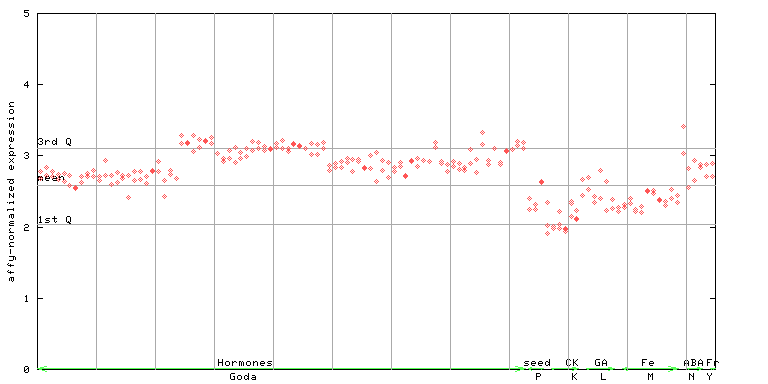
X axis is samples (xls file), and Y axis is log-expression. |
|||||||||||||||||||||||||||||||||


")
| Link to other DBs | ||
| Entrez Gene ID | 840326 |
|
| Refseq ID (protein) | NP_001319143.1 | |
| NP_001321919.1 | |
|
| NP_001321920.1 | |
|
| NP_174686.1 | |
|
The preparation time of this page was 0.2 [sec].