[←][→] ath
| functional annotation | |||||||||||||||||||||||||||||||
| Function | S-adenosyl-L-methionine-dependent methyltransferases superfamily protein |


|
|||||||||||||||||||||||||||||
| GO BP |
|
||||||||||||||||||||||||||||||
| GO CC |
|
||||||||||||||||||||||||||||||
| GO MF |
|
||||||||||||||||||||||||||||||
| KEGG | |||||||||||||||||||||||||||||||
| Protein | NP_001031144.1 NP_564470.1 | ||||||||||||||||||||||||||||||
| BLAST | NP_001031144.1 NP_564470.1 | ||||||||||||||||||||||||||||||
| Orthologous | [Ortholog page] LOC4330741 (osa) LOC7495129 (ppo) LOC25488378 (mtr) LOC100262638 (vvi) LOC100784028 (gma) LOC100807751 (gma) LOC101263510 (sly) LOC103627749 (zma) LOC103848760 (bra) LOC103867438 (bra) | ||||||||||||||||||||||||||||||
| Subcellular localization wolf |
|
||||||||||||||||||||||||||||||
| Subcellular localization TargetP |
|
||||||||||||||||||||||||||||||
| Gene coexpression | |||||||||||||||||||||||||||||||
| Network*for coexpressed genes |
|
||||||||||||||||||||||||||||||
|---|---|---|---|---|---|---|---|---|---|---|---|---|---|---|---|---|---|---|---|---|---|---|---|---|---|---|---|---|---|---|---|
| Coexpressed gene list |
[Coexpressed gene list for AT1G36310] | ||||||||||||||||||||||||||||||
| Gene expression | |||||||||||||||||||||||||||||||
| All samples | [Expression pattern for all samples] | ||||||||||||||||||||||||||||||
| AtGenExpress* (Development) |
260128_at
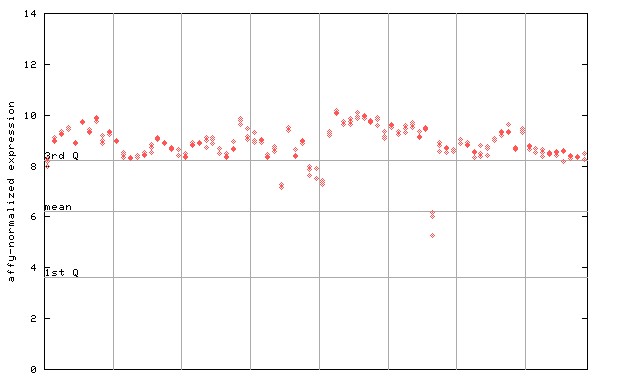
X axis is samples (pdf file), and Y axis is log2-expression. |
||||||||||||||||||||||||||||||
| AtGenExpress* (Stress) |
260128_at
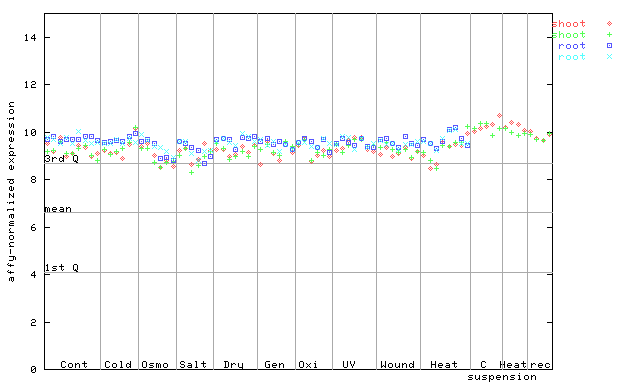
X axis is samples (pdf file), and Y axis is log2-expression. |
||||||||||||||||||||||||||||||
| AtGenExpress* (Hormone) |
260128_at
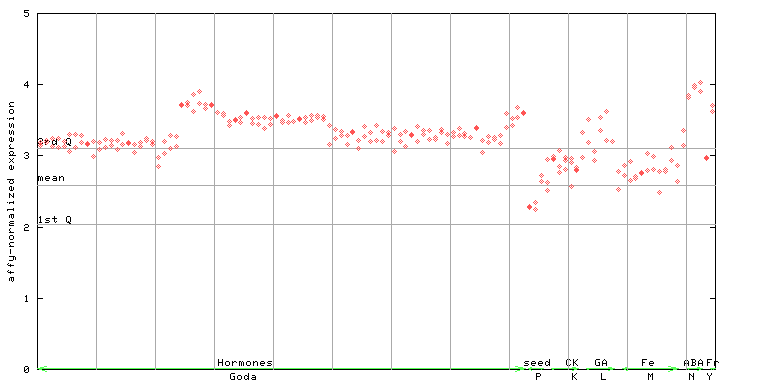
X axis is samples (xls file), and Y axis is log-expression. |
||||||||||||||||||||||||||||||


| Link to other DBs | ||
| Entrez Gene ID | 840538 |
|
| Refseq ID (protein) | NP_001031144.1 | |
| NP_564470.1 | |
|
The preparation time of this page was 0.2 [sec].