[←][→] ath
| functional annotation | ||||||||||||||||||||||||||||||||||||||
| Function | like COV 2 |


|
||||||||||||||||||||||||||||||||||||
| GO BP |
|
|||||||||||||||||||||||||||||||||||||
| GO CC |
|
|||||||||||||||||||||||||||||||||||||
| GO MF |
|
|||||||||||||||||||||||||||||||||||||
| KEGG | ||||||||||||||||||||||||||||||||||||||
| Protein | NP_001321430.1 NP_001321431.1 NP_564483.1 | |||||||||||||||||||||||||||||||||||||
| BLAST | NP_001321430.1 NP_001321431.1 NP_564483.1 | |||||||||||||||||||||||||||||||||||||
| Orthologous | [Ortholog page] LOC4325049 (osa) LOC4338904 (osa) LOC7467805 (ppo) LOC7489777 (ppo) LOC11423678 (mtr) LOC100191373 (zma) LOC100193368 (zma) LOC100217242 (zma) LOC100266324 (vvi) LOC100285618 (zma) LOC100792693 (gma) LOC100801920 (gma) LOC101249632 (sly) LOC101264314 (sly) LOC103833139 (bra) | |||||||||||||||||||||||||||||||||||||
| Subcellular localization wolf |
|
|||||||||||||||||||||||||||||||||||||
| Subcellular localization TargetP |
|
|||||||||||||||||||||||||||||||||||||
| Gene coexpression | ||||||||||||||||||||||||||||||||||||||
| Network*for coexpressed genes |
|
|||||||||||||||||||||||||||||||||||||
|---|---|---|---|---|---|---|---|---|---|---|---|---|---|---|---|---|---|---|---|---|---|---|---|---|---|---|---|---|---|---|---|---|---|---|---|---|---|---|
| Coexpressed gene list |
[Coexpressed gene list for LCV2] | |||||||||||||||||||||||||||||||||||||
| Gene expression | ||||||||||||||||||||||||||||||||||||||
| All samples | [Expression pattern for all samples] | |||||||||||||||||||||||||||||||||||||
| AtGenExpress* (Development) |
264422_at
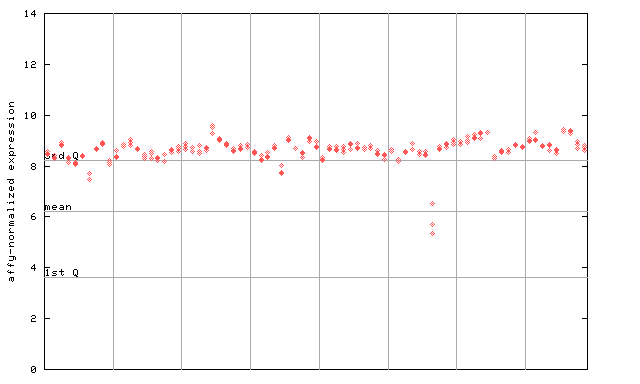
X axis is samples (pdf file), and Y axis is log2-expression. |
|||||||||||||||||||||||||||||||||||||
| AtGenExpress* (Stress) |
264422_at
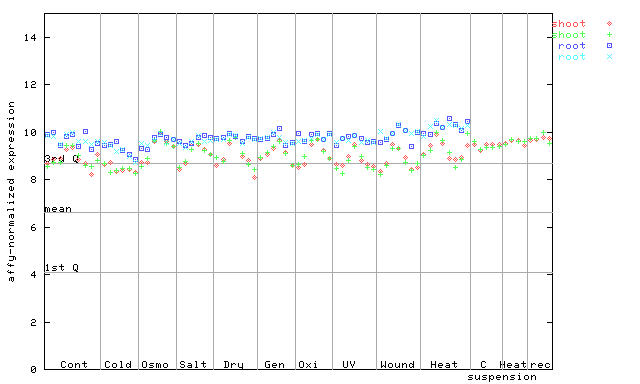
X axis is samples (pdf file), and Y axis is log2-expression. |
|||||||||||||||||||||||||||||||||||||
| AtGenExpress* (Hormone) |
264422_at
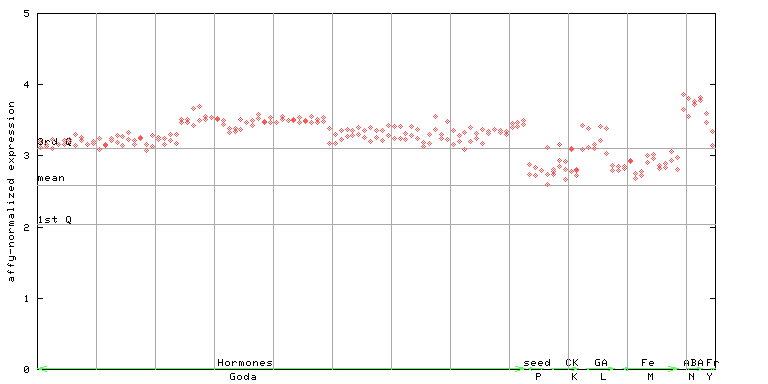
X axis is samples (xls file), and Y axis is log-expression. |
|||||||||||||||||||||||||||||||||||||


")
")
| Link to other DBs | ||
| Entrez Gene ID | 840912 |
|
| Refseq ID (protein) | NP_001321430.1 | |
| NP_001321431.1 | |
|
| NP_564483.1 | |
|
The preparation time of this page was 0.1 [sec].