[←][→] ath
| functional annotation | |||||||||||||||||||||||||||||||
| Function | Surfeit locus 1 cytochrome c oxidase biogenesis protein |


|
|||||||||||||||||||||||||||||
| GO BP |
|
||||||||||||||||||||||||||||||
| GO CC |
|
||||||||||||||||||||||||||||||
| GO MF |
|
||||||||||||||||||||||||||||||
| KEGG | |||||||||||||||||||||||||||||||
| Protein | NP_001319175.1 NP_001321912.1 NP_001321913.1 NP_175284.2 | ||||||||||||||||||||||||||||||
| BLAST | NP_001319175.1 NP_001321912.1 NP_001321913.1 NP_175284.2 | ||||||||||||||||||||||||||||||
| Orthologous | |||||||||||||||||||||||||||||||
| Subcellular localization wolf |
|
||||||||||||||||||||||||||||||
| Subcellular localization TargetP |
|
||||||||||||||||||||||||||||||
| Gene coexpression | |||||||||||||||||||||||||||||||
| Network*for coexpressed genes |
|
||||||||||||||||||||||||||||||
|---|---|---|---|---|---|---|---|---|---|---|---|---|---|---|---|---|---|---|---|---|---|---|---|---|---|---|---|---|---|---|---|
| Coexpressed gene list |
[Coexpressed gene list for AT1G48510] | ||||||||||||||||||||||||||||||
| Gene expression | |||||||||||||||||||||||||||||||
| All samples | [Expression pattern for all samples] | ||||||||||||||||||||||||||||||
| AtGenExpress* (Development) |
261298_at
X axis is samples (pdf file), and Y axis is log2-expression. |
||||||||||||||||||||||||||||||
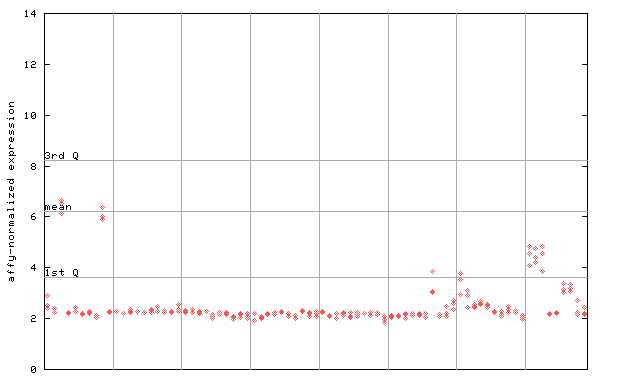
| AtGenExpress* (Stress) |
261298_at
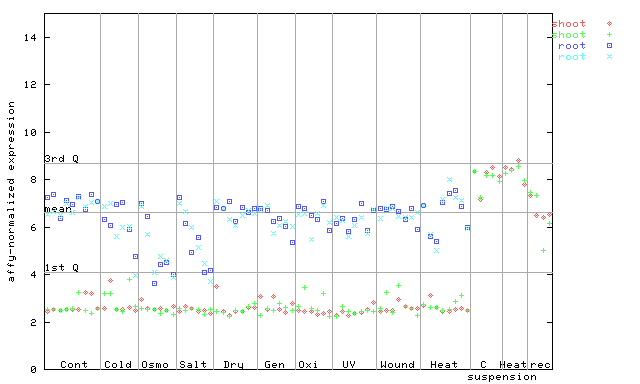
X axis is samples (pdf file), and Y axis is log2-expression. |
||||||||||||||||||||||||||||||
| AtGenExpress* (Hormone) |
261298_at
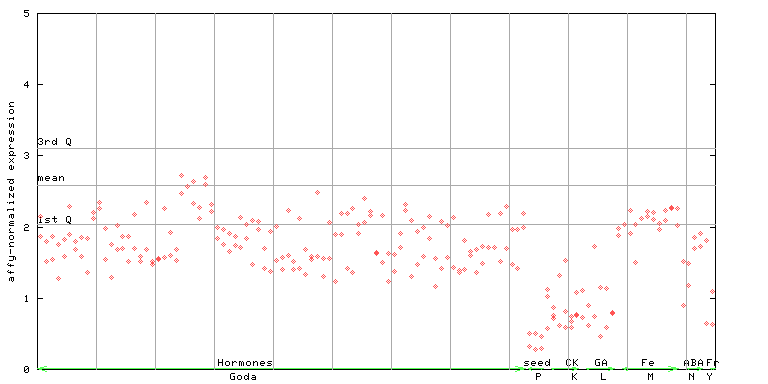
X axis is samples (xls file), and Y axis is log-expression. |
||||||||||||||||||||||||||||||


| Link to other DBs | ||
| Entrez Gene ID | 841272 |
|
| Refseq ID (protein) | NP_001319175.1 | |
| NP_001321912.1 | |
|
| NP_001321913.1 | |
|
| NP_175284.2 | |
|
The preparation time of this page was 0.1 [sec].