[←][→] ath
| functional annotation | ||||||||||||||||||||||||||||||||||
| Function | Erv1/Alr family protein |


|
||||||||||||||||||||||||||||||||
| GO BP |
|
|||||||||||||||||||||||||||||||||
| GO CC |
|
|||||||||||||||||||||||||||||||||
| GO MF |
|
|||||||||||||||||||||||||||||||||
| KEGG | ||||||||||||||||||||||||||||||||||
| Protein | NP_001320835.1 NP_564557.1 | |||||||||||||||||||||||||||||||||
| BLAST | NP_001320835.1 NP_564557.1 | |||||||||||||||||||||||||||||||||
| Orthologous | [Ortholog page] LOC7469626 (ppo) LOC9270137 (osa) LOC11416432 (mtr) LOC25481454 (mtr) LOC25483252 (mtr) LOC100263572 (vvi) LOC100281926 (zma) LOC100782995 (gma) LOC100795034 (gma) LOC101263280 (sly) LOC103832909 (bra) | |||||||||||||||||||||||||||||||||
| Subcellular localization wolf |
|
|||||||||||||||||||||||||||||||||
| Subcellular localization TargetP |
|
|||||||||||||||||||||||||||||||||
| Gene coexpression | ||||||||||||||||||||||||||||||||||
| Network*for coexpressed genes |
|
|||||||||||||||||||||||||||||||||
|---|---|---|---|---|---|---|---|---|---|---|---|---|---|---|---|---|---|---|---|---|---|---|---|---|---|---|---|---|---|---|---|---|---|---|
| Coexpressed gene list |
[Coexpressed gene list for Erv1] | |||||||||||||||||||||||||||||||||
| Gene expression | ||||||||||||||||||||||||||||||||||
| All samples | [Expression pattern for all samples] | |||||||||||||||||||||||||||||||||
| AtGenExpress* (Development) |
259817_at
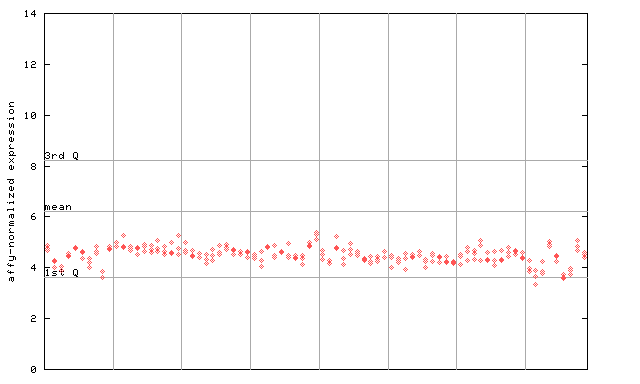
X axis is samples (pdf file), and Y axis is log2-expression. |
|||||||||||||||||||||||||||||||||
| AtGenExpress* (Stress) |
259817_at
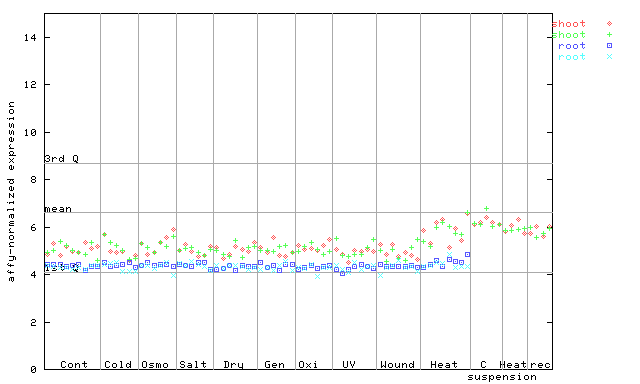
X axis is samples (pdf file), and Y axis is log2-expression. |
|||||||||||||||||||||||||||||||||
| AtGenExpress* (Hormone) |
259817_at
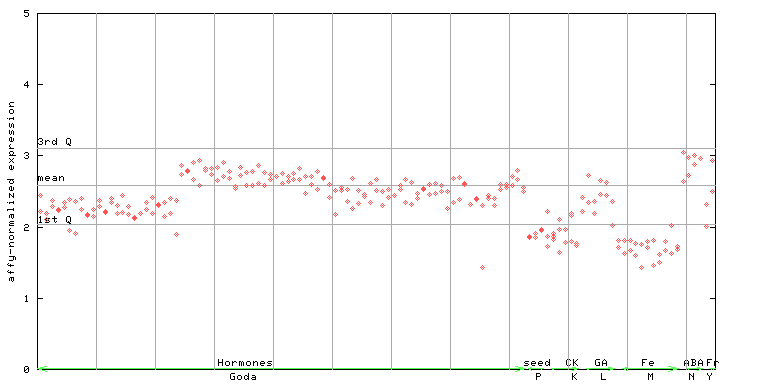
X axis is samples (xls file), and Y axis is log-expression. |
|||||||||||||||||||||||||||||||||


")
| Link to other DBs | ||
| Entrez Gene ID | 841411 |
|
| Refseq ID (protein) | NP_001320835.1 | |
| NP_564557.1 | |
|
The preparation time of this page was 0.1 [sec].