[←][→] ath
| functional annotation | ||||||||||||||||||||||||||||||||||||||||||
| Function | ARM repeat superfamily protein |


|
||||||||||||||||||||||||||||||||||||||||
| GO BP |
|
|||||||||||||||||||||||||||||||||||||||||
| GO CC |
|
|||||||||||||||||||||||||||||||||||||||||
| GO MF |
|
|||||||||||||||||||||||||||||||||||||||||
| KEGG | ||||||||||||||||||||||||||||||||||||||||||
| Protein | NP_175502.2 | |||||||||||||||||||||||||||||||||||||||||
| BLAST | NP_175502.2 | |||||||||||||||||||||||||||||||||||||||||
| Orthologous | [Ortholog page] LOC778348 (sly) TOR1 (ath) LOC4343400 (osa) LOC7454426 (ppo) LOC11419505 (mtr) LOC100247015 (vvi) LOC100775602 (gma) LOC100804845 (gma) LOC103633238 (zma) LOC103647714 (zma) LOC103866808 (bra) LOC103868604 (bra) | |||||||||||||||||||||||||||||||||||||||||
| Subcellular localization wolf |
|
|||||||||||||||||||||||||||||||||||||||||
| Subcellular localization TargetP |
|
|||||||||||||||||||||||||||||||||||||||||
| Gene coexpression | ||||||||||||||||||||||||||||||||||||||||||
| Network*for coexpressed genes |
|
|||||||||||||||||||||||||||||||||||||||||
|---|---|---|---|---|---|---|---|---|---|---|---|---|---|---|---|---|---|---|---|---|---|---|---|---|---|---|---|---|---|---|---|---|---|---|---|---|---|---|---|---|---|---|
| Coexpressed gene list |
[Coexpressed gene list for AT1G50890] | |||||||||||||||||||||||||||||||||||||||||
| Gene expression | ||||||||||||||||||||||||||||||||||||||||||
| All samples | [Expression pattern for all samples] | |||||||||||||||||||||||||||||||||||||||||
| AtGenExpress* (Development) |
256205_at
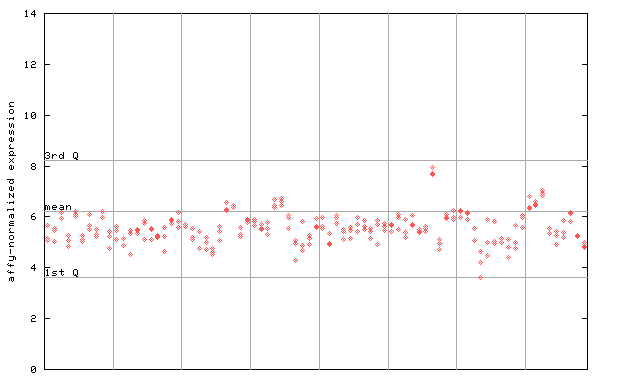
X axis is samples (pdf file), and Y axis is log2-expression. |
|||||||||||||||||||||||||||||||||||||||||
| AtGenExpress* (Stress) |
256205_at
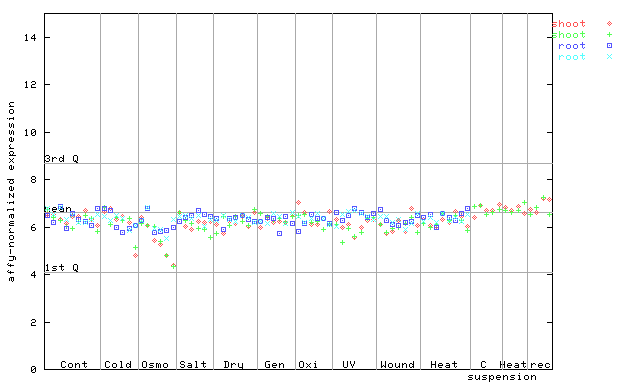
X axis is samples (pdf file), and Y axis is log2-expression. |
|||||||||||||||||||||||||||||||||||||||||
| AtGenExpress* (Hormone) |
256205_at
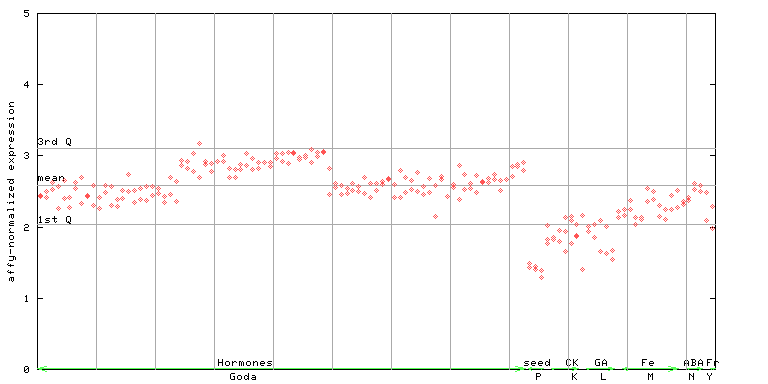
X axis is samples (xls file), and Y axis is log-expression. |
|||||||||||||||||||||||||||||||||||||||||


")
")
")
| Link to other DBs | ||
| Entrez Gene ID | 841511 |
|
| Refseq ID (protein) | NP_175502.2 | |
The preparation time of this page was 0.1 [sec].