[←][→] ath
| functional annotation | ||||||||||||||||||||||||||
| Function | Legume lectin family protein |


|
||||||||||||||||||||||||
| GO BP |
|
|||||||||||||||||||||||||
| GO CC |
|
|||||||||||||||||||||||||
| GO MF |
|
|||||||||||||||||||||||||
| KEGG | ||||||||||||||||||||||||||
| Protein | NP_175714.1 | |||||||||||||||||||||||||
| BLAST | NP_175714.1 | |||||||||||||||||||||||||
| Orthologous | [Ortholog page] AT3G15356 (ath) AT3G16530 (ath) AT5G03350 (ath) AT1G53070 (ath) LOC103840846 (bra) LOC103843211 (bra) LOC103850491 (bra) LOC103869935 (bra) LOC103871158 (bra) LOC103871159 (bra) | |||||||||||||||||||||||||
| Subcellular localization wolf |
|
|||||||||||||||||||||||||
| Subcellular localization TargetP |
|
|||||||||||||||||||||||||
| Gene coexpression | ||||||||||||||||||||||||||
| Network*for coexpressed genes |
|
|||||||||||||||||||||||||
|---|---|---|---|---|---|---|---|---|---|---|---|---|---|---|---|---|---|---|---|---|---|---|---|---|---|---|
| Coexpressed gene list |
[Coexpressed gene list for AT1G53060] | |||||||||||||||||||||||||
| Gene expression | ||||||||||||||||||||||||||
| All samples | [Expression pattern for all samples] | |||||||||||||||||||||||||
| AtGenExpress* (Development) |
261369_at
X axis is samples (pdf file), and Y axis is log2-expression. |
|||||||||||||||||||||||||
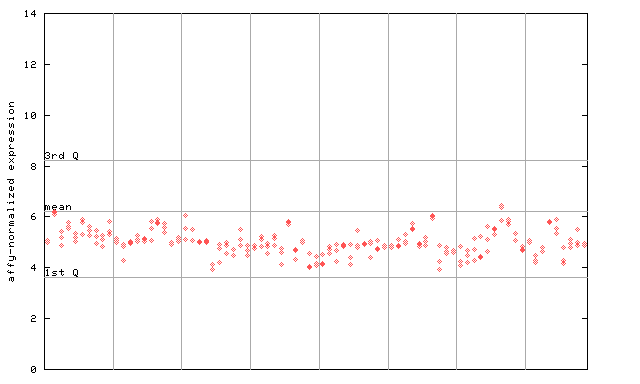
| AtGenExpress* (Stress) |
261369_at
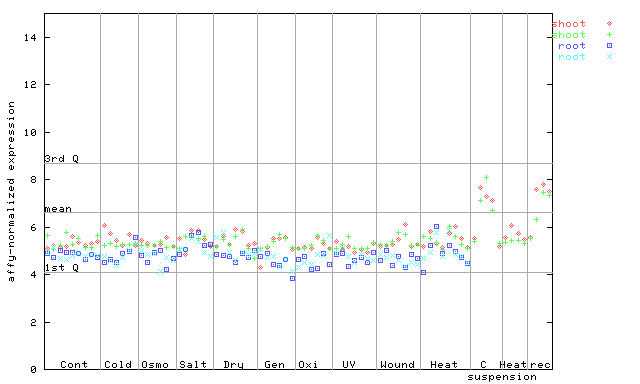
X axis is samples (pdf file), and Y axis is log2-expression. |
|||||||||||||||||||||||||
| AtGenExpress* (Hormone) |
261369_at
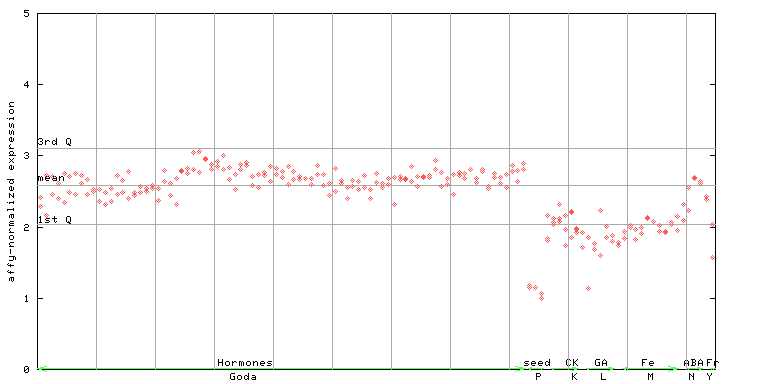
X axis is samples (xls file), and Y axis is log-expression. |
|||||||||||||||||||||||||


| Link to other DBs | ||
| Entrez Gene ID | 841740 |
|
| Refseq ID (protein) | NP_175714.1 | |
The preparation time of this page was 0.2 [sec].