[←][→] ath
| functional annotation | |||||||||||||||||||||||||||||||||||||||||||||||||||||
| Function | ABC-2 type transporter family protein |


|
|||||||||||||||||||||||||||||||||||||||||||||||||||
| GO BP |
|
||||||||||||||||||||||||||||||||||||||||||||||||||||
| GO CC |
|
||||||||||||||||||||||||||||||||||||||||||||||||||||
| GO MF |
|
||||||||||||||||||||||||||||||||||||||||||||||||||||
| KEGG | |||||||||||||||||||||||||||||||||||||||||||||||||||||
| Protein | NP_175734.1 | ||||||||||||||||||||||||||||||||||||||||||||||||||||
| BLAST | NP_175734.1 | ||||||||||||||||||||||||||||||||||||||||||||||||||||
| Orthologous | [Ortholog page] LOC4326649 (osa) LOC7455959 (ppo) LOC25487254 (mtr) LOC100243490 (vvi) LOC100267668 (vvi) LOC100281534 (zma) LOC100776372 (gma) LOC100807754 (gma) ABCG19 (sly) ABCG18 (sly) LOC103651606 (zma) LOC103832679 (bra) | ||||||||||||||||||||||||||||||||||||||||||||||||||||
| Subcellular localization wolf |
|
||||||||||||||||||||||||||||||||||||||||||||||||||||
| Subcellular localization TargetP |
|
||||||||||||||||||||||||||||||||||||||||||||||||||||
| Gene coexpression | |||||||||||||||||||||||||||||||||||||||||||||||||||||
| Network*for coexpressed genes |
|
||||||||||||||||||||||||||||||||||||||||||||||||||||
|---|---|---|---|---|---|---|---|---|---|---|---|---|---|---|---|---|---|---|---|---|---|---|---|---|---|---|---|---|---|---|---|---|---|---|---|---|---|---|---|---|---|---|---|---|---|---|---|---|---|---|---|---|---|
| Coexpressed gene list |
[Coexpressed gene list for ABCG10] | ||||||||||||||||||||||||||||||||||||||||||||||||||||
| Gene expression | |||||||||||||||||||||||||||||||||||||||||||||||||||||
| All samples | [Expression pattern for all samples] | ||||||||||||||||||||||||||||||||||||||||||||||||||||
| AtGenExpress* (Development) |
260643_at
X axis is samples (pdf file), and Y axis is log2-expression. |
||||||||||||||||||||||||||||||||||||||||||||||||||||
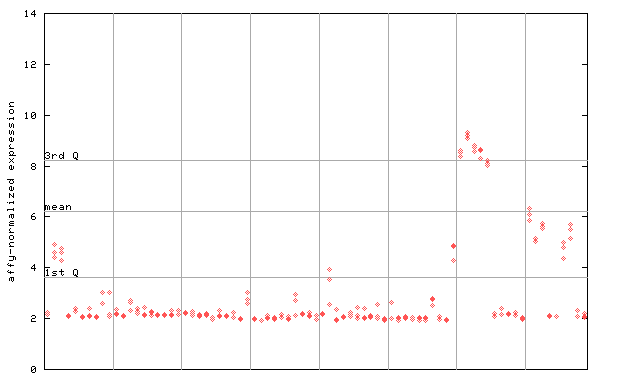
| AtGenExpress* (Stress) |
260643_at
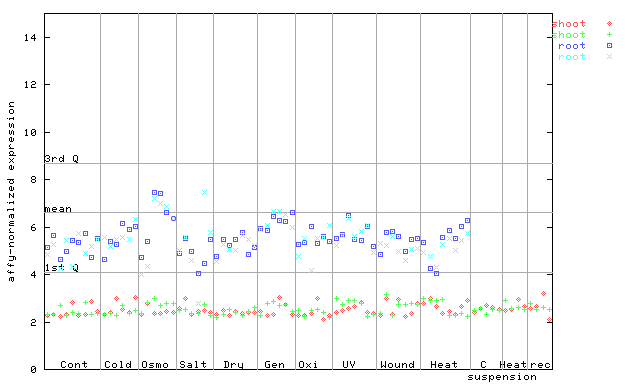
X axis is samples (pdf file), and Y axis is log2-expression. |
||||||||||||||||||||||||||||||||||||||||||||||||||||
| AtGenExpress* (Hormone) |
260643_at
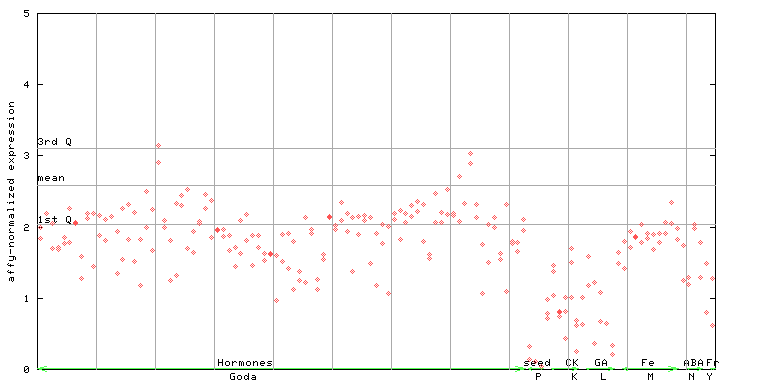
X axis is samples (xls file), and Y axis is log-expression. |
||||||||||||||||||||||||||||||||||||||||||||||||||||


")
")
| Link to other DBs | ||
| Entrez Gene ID | 841761 |
|
| Refseq ID (protein) | NP_175734.1 | |
The preparation time of this page was 0.2 [sec].