[←][→] ath
| functional annotation | ||||||||||||||||||||||||||||||||||
| Function | NDH-dependent cyclic electron flow 5 |


|
||||||||||||||||||||||||||||||||
| GO BP |
|
|||||||||||||||||||||||||||||||||
| GO CC |
|
|||||||||||||||||||||||||||||||||
| GO MF |
|
|||||||||||||||||||||||||||||||||
| KEGG | ||||||||||||||||||||||||||||||||||
| Protein | NP_564687.1 NP_849810.1 | |||||||||||||||||||||||||||||||||
| BLAST | NP_564687.1 NP_849810.1 | |||||||||||||||||||||||||||||||||
| Orthologous | [Ortholog page] LOC4334106 (osa) LOC7469878 (ppo) LOC11412540 (mtr) LOC100267590 (vvi) LOC100775728 (gma) LOC101263088 (sly) LOC103644004 (zma) LOC103871039 (bra) | |||||||||||||||||||||||||||||||||
| Subcellular localization wolf |
|
|||||||||||||||||||||||||||||||||
| Subcellular localization TargetP |
|
|||||||||||||||||||||||||||||||||
| Gene coexpression | ||||||||||||||||||||||||||||||||||
| Network*for coexpressed genes |
|
|||||||||||||||||||||||||||||||||
|---|---|---|---|---|---|---|---|---|---|---|---|---|---|---|---|---|---|---|---|---|---|---|---|---|---|---|---|---|---|---|---|---|---|---|
| Coexpressed gene list |
[Coexpressed gene list for NDF5] | |||||||||||||||||||||||||||||||||
| Gene expression | ||||||||||||||||||||||||||||||||||
| All samples | [Expression pattern for all samples] | |||||||||||||||||||||||||||||||||
| AtGenExpress* (Development) |
259658_at
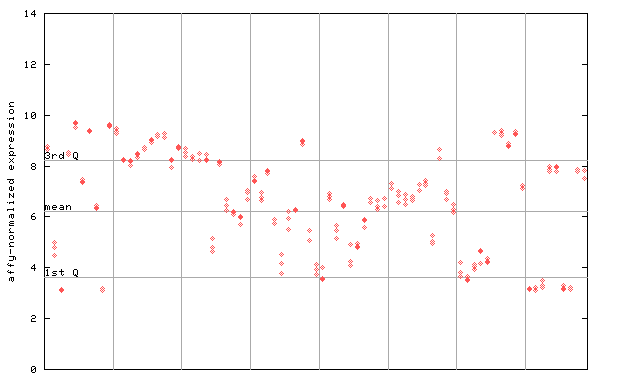
X axis is samples (pdf file), and Y axis is log2-expression. |
|||||||||||||||||||||||||||||||||
| AtGenExpress* (Stress) |
259658_at
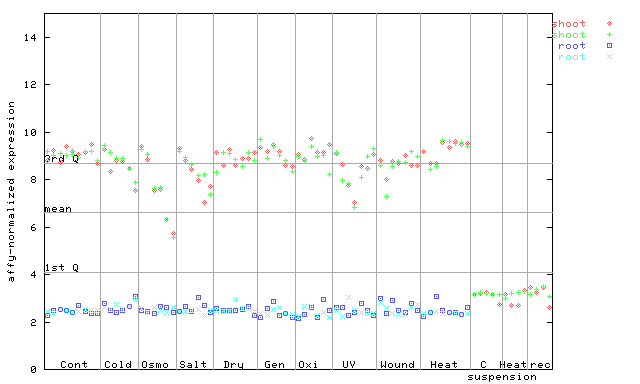
X axis is samples (pdf file), and Y axis is log2-expression. |
|||||||||||||||||||||||||||||||||
| AtGenExpress* (Hormone) |
259658_at
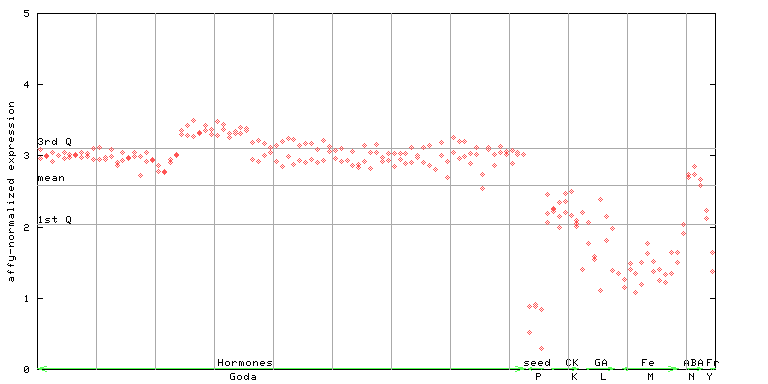
X axis is samples (xls file), and Y axis is log-expression. |
|||||||||||||||||||||||||||||||||


")
| Link to other DBs | ||
| Entrez Gene ID | 841984 |
|
| Refseq ID (protein) | NP_564687.1 | |
| NP_849810.1 | |
|
The preparation time of this page was 0.2 [sec].