[←][→] ath
| functional annotation | ||||||||||||||||||||||||||
| Function | Clathrin adaptor complexes medium subunit family protein |


|
||||||||||||||||||||||||
| GO BP |
|
|||||||||||||||||||||||||
| GO CC |
|
|||||||||||||||||||||||||
| GO MF |
|
|||||||||||||||||||||||||
| KEGG | ||||||||||||||||||||||||||
| Protein | NP_176052.3 | |||||||||||||||||||||||||
| BLAST | NP_176052.3 | |||||||||||||||||||||||||
| Orthologous | [Ortholog page] LOC4338648 (osa) LOC7478887 (ppo) LOC25499635 (mtr) LOC100251056 (vvi) LOC100273129 (zma) LOC100782926 (gma) LOC100791605 (gma) LOC100799191 (gma) LOC101256128 (sly) LOC103838673 (bra) | |||||||||||||||||||||||||
| Subcellular localization wolf |
|
|||||||||||||||||||||||||
| Subcellular localization TargetP |
|
|||||||||||||||||||||||||
| Gene coexpression | ||||||||||||||||||||||||||
| Network*for coexpressed genes |
|
|||||||||||||||||||||||||
|---|---|---|---|---|---|---|---|---|---|---|---|---|---|---|---|---|---|---|---|---|---|---|---|---|---|---|
| Coexpressed gene list |
[Coexpressed gene list for ZIP4] | |||||||||||||||||||||||||
| Gene expression | ||||||||||||||||||||||||||
| All samples | [Expression pattern for all samples] | |||||||||||||||||||||||||
| AtGenExpress* (Development) |
245679_at
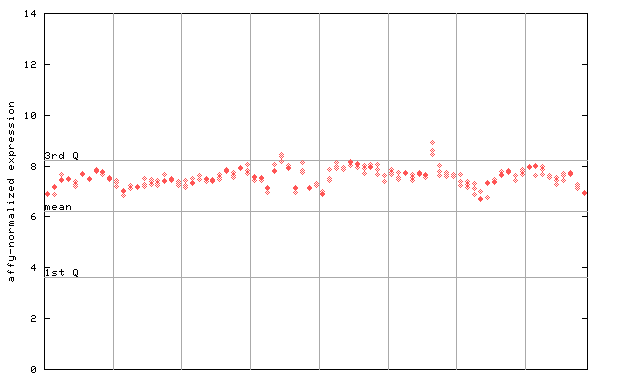
X axis is samples (pdf file), and Y axis is log2-expression. |
|||||||||||||||||||||||||
| AtGenExpress* (Stress) |
245679_at
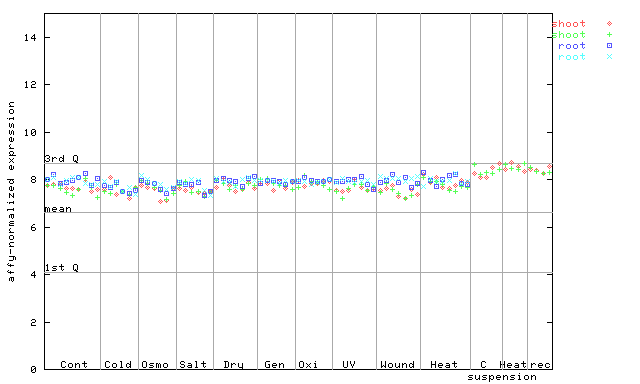
X axis is samples (pdf file), and Y axis is log2-expression. |
|||||||||||||||||||||||||
| AtGenExpress* (Hormone) |
245679_at
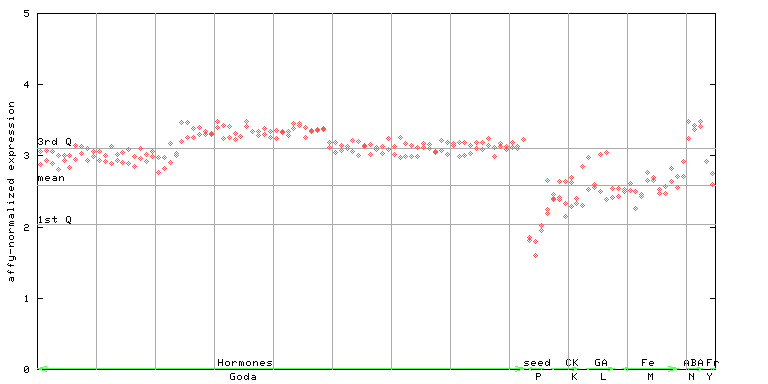
X axis is samples (xls file), and Y axis is log-expression. |
|||||||||||||||||||||||||


| Link to other DBs | ||
| Entrez Gene ID | 842113 |
|
| Refseq ID (protein) | NP_176052.3 | |
The preparation time of this page was 0.2 [sec].