[←][→] ath
| functional annotation | ||||||||||||||||||||||||||||||||||||||||||||||||||
| Function | 3-ketoacyl-acyl carrier protein synthase III |


|
||||||||||||||||||||||||||||||||||||||||||||||||
| GO BP |
|
|||||||||||||||||||||||||||||||||||||||||||||||||
| GO CC |
|
|||||||||||||||||||||||||||||||||||||||||||||||||
| GO MF |
|
|||||||||||||||||||||||||||||||||||||||||||||||||
| KEGG | ath00061 [list] [network] Fatty acid biosynthesis (43 genes) |  |
||||||||||||||||||||||||||||||||||||||||||||||||
| ath01212 [list] [network] Fatty acid metabolism (69 genes) | |
|||||||||||||||||||||||||||||||||||||||||||||||||
| Protein | NP_001031221.1 NP_176452.1 | |||||||||||||||||||||||||||||||||||||||||||||||||
| BLAST | NP_001031221.1 NP_176452.1 | |||||||||||||||||||||||||||||||||||||||||||||||||
| Orthologous | [Ortholog page] LOC548033 (gma) LOC4337178 (osa) LOC7465522 (ppo) LOC11423734 (mtr) LOC25487983 (mtr) LOC100245497 (vvi) LOC100280714 (zma) LOC100280787 (zma) LOC100807972 (gma) LOC100813007 (gma) LOC100854507 (vvi) LOC101244208 (sly) LOC101249057 (sly) LOC103838061 (bra) LOC103838380 (bra) | |||||||||||||||||||||||||||||||||||||||||||||||||
| Subcellular localization wolf |
|
|||||||||||||||||||||||||||||||||||||||||||||||||
| Subcellular localization TargetP |
|
|||||||||||||||||||||||||||||||||||||||||||||||||
| Gene coexpression | ||||||||||||||||||||||||||||||||||||||||||||||||||
| Network*for coexpressed genes |
|
|||||||||||||||||||||||||||||||||||||||||||||||||
|---|---|---|---|---|---|---|---|---|---|---|---|---|---|---|---|---|---|---|---|---|---|---|---|---|---|---|---|---|---|---|---|---|---|---|---|---|---|---|---|---|---|---|---|---|---|---|---|---|---|---|
| Coexpressed gene list |
[Coexpressed gene list for KAS III] | |||||||||||||||||||||||||||||||||||||||||||||||||
| Gene expression | ||||||||||||||||||||||||||||||||||||||||||||||||||
| All samples | [Expression pattern for all samples] | |||||||||||||||||||||||||||||||||||||||||||||||||
| AtGenExpress* (Development) |
265120_at
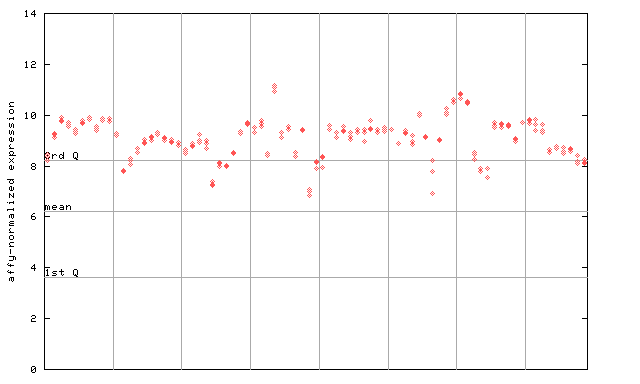
X axis is samples (pdf file), and Y axis is log2-expression. |
|||||||||||||||||||||||||||||||||||||||||||||||||
| AtGenExpress* (Stress) |
265120_at
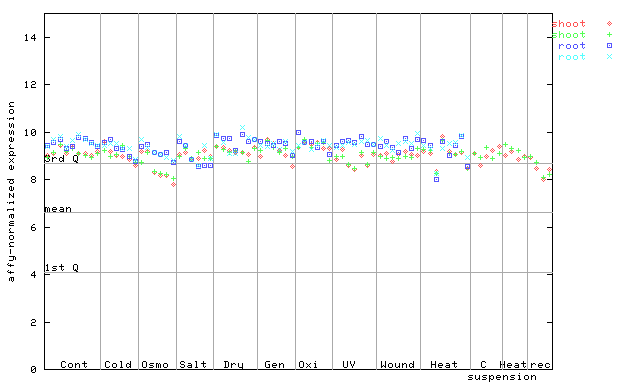
X axis is samples (pdf file), and Y axis is log2-expression. |
|||||||||||||||||||||||||||||||||||||||||||||||||
| AtGenExpress* (Hormone) |
265120_at
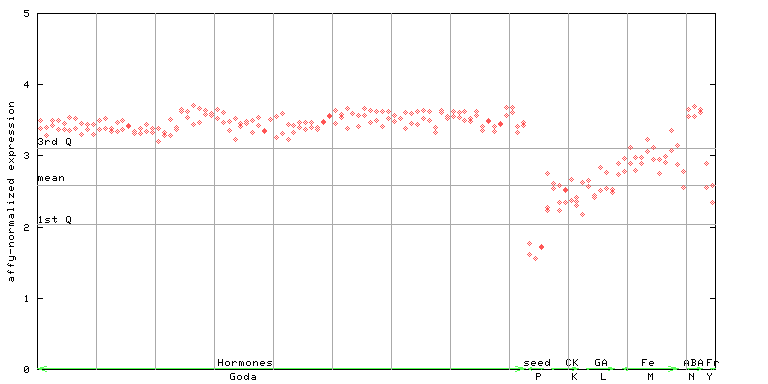
X axis is samples (xls file), and Y axis is log-expression. |
|||||||||||||||||||||||||||||||||||||||||||||||||


")
")
")
")
")
| Link to other DBs | ||
| Entrez Gene ID | 842561 |
|
| Refseq ID (protein) | NP_001031221.1 | |
| NP_176452.1 | |
|
The preparation time of this page was 0.2 [sec].