[←][→] ath
| functional annotation | ||||||||||
| Function | Plant thionin |


|
||||||||
| GO BP |
|
|||||||||
| GO CC |
|
|||||||||
| GO MF |
|
|||||||||
| KEGG | ||||||||||
| Protein | NP_176784.1 | |||||||||
| BLAST | NP_176784.1 | |||||||||
| Orthologous | [Ortholog page] AT2G15010 (ath) THI2.2 (ath) THI2.1 (ath) LOC4341150 (osa) LOC4341152 (osa) LOC4341158 (osa) LOC9268035 (osa) LOC9268722 (osa) LOC9269162 (osa) LOC9270626 (osa) LOC9272249 (osa) LOC103858688 (bra) LOC103859377 (bra) LOC107276204 (osa) LOC107281352 (osa) | |||||||||
| Subcellular localization wolf |
|
|||||||||
| Subcellular localization TargetP |
|
|||||||||
| Gene coexpression | ||||||||||
| Network*for coexpressed genes |
||||||||||
|---|---|---|---|---|---|---|---|---|---|---|
| Coexpressed gene list |
[Coexpressed gene list for AT1G66100] | |||||||||
| Gene expression | ||||||||||
| All samples | [Expression pattern for all samples] | |||||||||
| AtGenExpress* (Development) |
256527_at
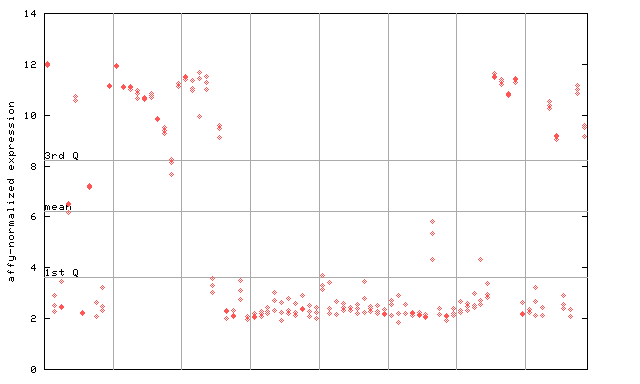
X axis is samples (pdf file), and Y axis is log2-expression. |
|||||||||
| AtGenExpress* (Stress) |
256527_at
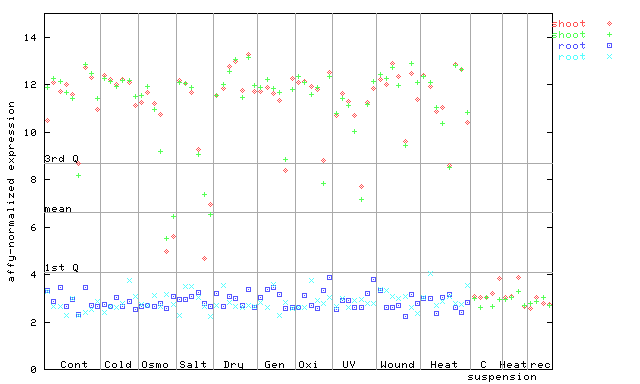
X axis is samples (pdf file), and Y axis is log2-expression. |
|||||||||
| AtGenExpress* (Hormone) |
256527_at
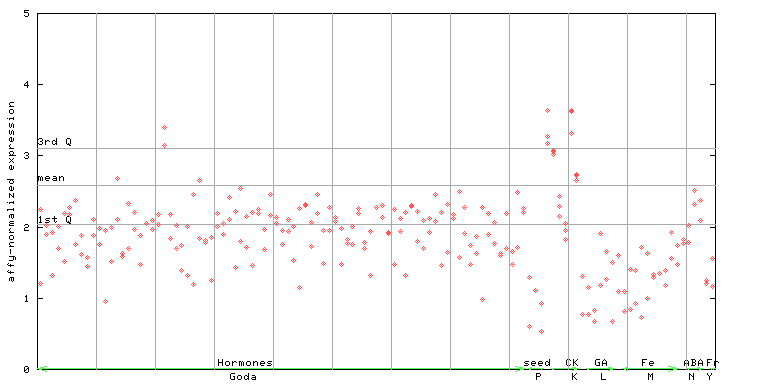
X axis is samples (xls file), and Y axis is log-expression. |
|||||||||


| Link to other DBs | ||
| Entrez Gene ID | 842924 |
|
| Refseq ID (protein) | NP_176784.1 | |
The preparation time of this page was 0.2 [sec].