[←][→] ath
| functional annotation | ||||||||||||||||||||||||||||||||||
| Function | ARM repeat superfamily protein |


|
||||||||||||||||||||||||||||||||
| GO BP |
|
|||||||||||||||||||||||||||||||||
| GO CC |
|
|||||||||||||||||||||||||||||||||
| GO MF |
|
|||||||||||||||||||||||||||||||||
| KEGG | ||||||||||||||||||||||||||||||||||
| Protein | NP_001117582.1 NP_177258.3 | |||||||||||||||||||||||||||||||||
| BLAST | NP_001117582.1 NP_177258.3 | |||||||||||||||||||||||||||||||||
| Orthologous | [Ortholog page] AT1G23030 (ath) LOC4330628 (osa) LOC7482877 (ppo) LOC25494445 (mtr) LOC100193248 (zma) LOC100264511 (vvi) LOC100811123 (gma) LOC100815448 (gma) LOC101251973 (sly) LOC101256774 (sly) LOC103829297 (bra) LOC103831633 (bra) LOC103840801 (bra) | |||||||||||||||||||||||||||||||||
| Subcellular localization wolf |
|
|||||||||||||||||||||||||||||||||
| Subcellular localization TargetP |
|
|||||||||||||||||||||||||||||||||
| Gene coexpression | ||||||||||||||||||||||||||||||||||
| Network*for coexpressed genes |
|
|||||||||||||||||||||||||||||||||
|---|---|---|---|---|---|---|---|---|---|---|---|---|---|---|---|---|---|---|---|---|---|---|---|---|---|---|---|---|---|---|---|---|---|---|
| Coexpressed gene list |
[Coexpressed gene list for AT1G71020] | |||||||||||||||||||||||||||||||||
| Gene expression | ||||||||||||||||||||||||||||||||||
| All samples | [Expression pattern for all samples] | |||||||||||||||||||||||||||||||||
| AtGenExpress* (Development) |
259741_at
X axis is samples (pdf file), and Y axis is log2-expression. |
|||||||||||||||||||||||||||||||||
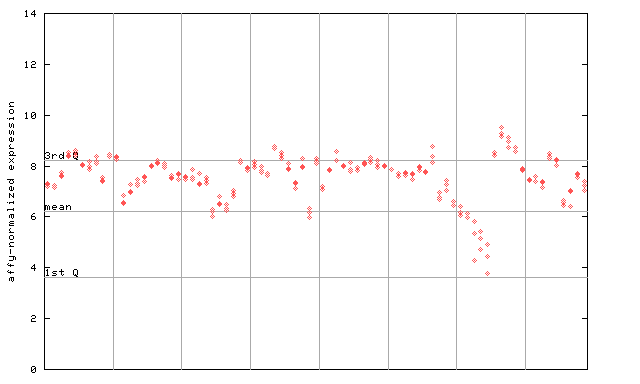
| AtGenExpress* (Stress) |
259741_at
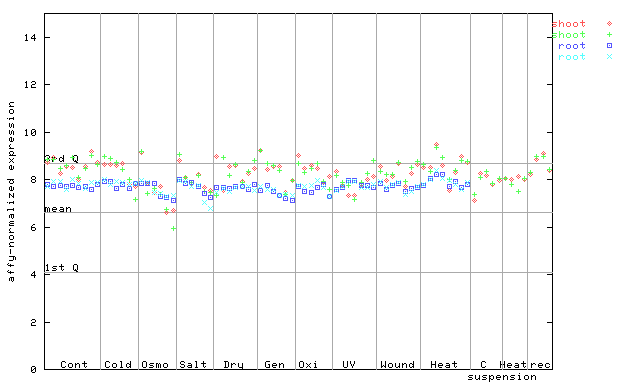
X axis is samples (pdf file), and Y axis is log2-expression. |
|||||||||||||||||||||||||||||||||
| AtGenExpress* (Hormone) |
259741_at
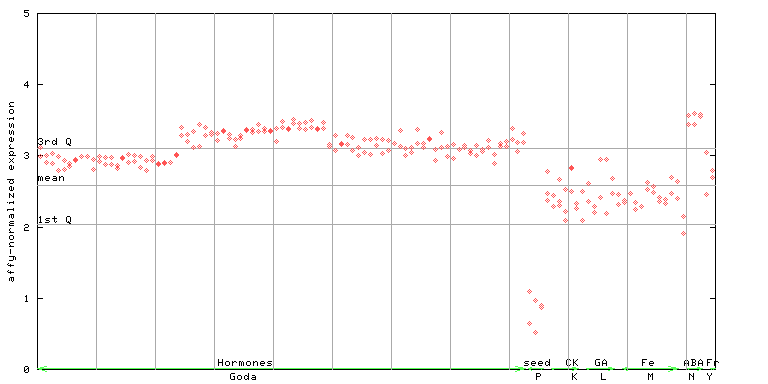
X axis is samples (xls file), and Y axis is log-expression. |
|||||||||||||||||||||||||||||||||


")
| Link to other DBs | ||
| Entrez Gene ID | 843442 |
|
| Refseq ID (protein) | NP_001117582.1 | |
| NP_177258.3 | |
|
The preparation time of this page was 0.2 [sec].