[←][→] ath
| functional annotation | |||||||||||||||||||||||||||||||||||||||||||||||||
| Function | 6-phosphogluconate dehydrogenase family protein |


|
|||||||||||||||||||||||||||||||||||||||||||||||
| GO BP |
|
||||||||||||||||||||||||||||||||||||||||||||||||
| GO CC |
|
||||||||||||||||||||||||||||||||||||||||||||||||
| GO MF |
|
||||||||||||||||||||||||||||||||||||||||||||||||
| KEGG | |||||||||||||||||||||||||||||||||||||||||||||||||
| Protein | NP_565014.1 | ||||||||||||||||||||||||||||||||||||||||||||||||
| BLAST | NP_565014.1 | ||||||||||||||||||||||||||||||||||||||||||||||||
| Orthologous | [Ortholog page] AT1G71170 (ath) LOC7486674 (ppo) LOC11436146 (mtr) LOC100244682 (vvi) LOC100277777 (zma) LOC100816810 (gma) LOC101263543 (sly) LOC103852707 (bra) | ||||||||||||||||||||||||||||||||||||||||||||||||
| Subcellular localization wolf |
|
||||||||||||||||||||||||||||||||||||||||||||||||
| Subcellular localization TargetP |
|
||||||||||||||||||||||||||||||||||||||||||||||||
| Gene coexpression | |||||||||||||||||||||||||||||||||||||||||||||||||
| Network*for coexpressed genes |
|
||||||||||||||||||||||||||||||||||||||||||||||||
|---|---|---|---|---|---|---|---|---|---|---|---|---|---|---|---|---|---|---|---|---|---|---|---|---|---|---|---|---|---|---|---|---|---|---|---|---|---|---|---|---|---|---|---|---|---|---|---|---|---|
| Coexpressed gene list |
[Coexpressed gene list for AT1G71180] | ||||||||||||||||||||||||||||||||||||||||||||||||
| Gene expression | |||||||||||||||||||||||||||||||||||||||||||||||||
| All samples | [Expression pattern for all samples] | ||||||||||||||||||||||||||||||||||||||||||||||||
| AtGenExpress* (Development) |
259748_at
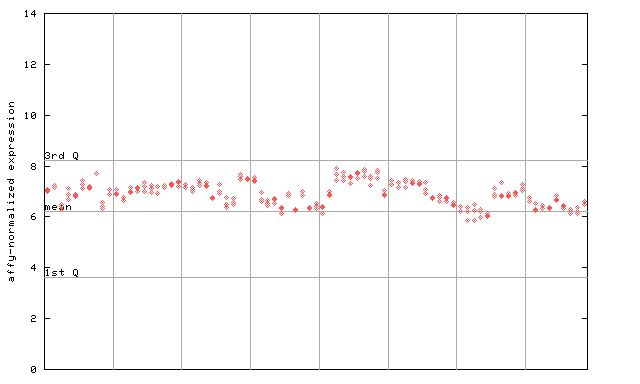
X axis is samples (pdf file), and Y axis is log2-expression. |
||||||||||||||||||||||||||||||||||||||||||||||||
| AtGenExpress* (Stress) |
259748_at
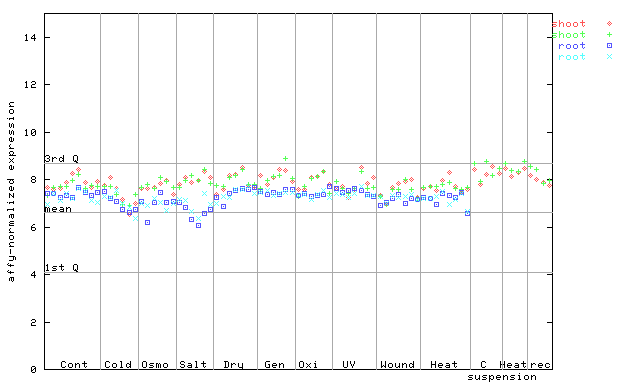
X axis is samples (pdf file), and Y axis is log2-expression. |
||||||||||||||||||||||||||||||||||||||||||||||||
| AtGenExpress* (Hormone) |
259748_at
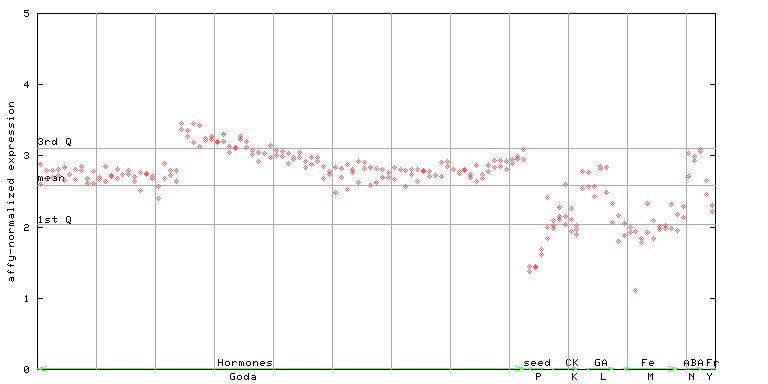
X axis is samples (xls file), and Y axis is log-expression. |
||||||||||||||||||||||||||||||||||||||||||||||||


")
| Link to other DBs | ||
| Entrez Gene ID | 843458 |
|
| Refseq ID (protein) | NP_565014.1 | |
The preparation time of this page was 0.2 [sec].