[←][→] ath
| functional annotation | |||||||||||||||||||||||||||||||
| Function | LYR family of Fe/S cluster biogenesis protein |


|
|||||||||||||||||||||||||||||
| GO BP |
|
||||||||||||||||||||||||||||||
| GO CC |
|
||||||||||||||||||||||||||||||
| GO MF |
|
||||||||||||||||||||||||||||||
| KEGG | |||||||||||||||||||||||||||||||
| Protein | NP_177733.2 | ||||||||||||||||||||||||||||||
| BLAST | NP_177733.2 | ||||||||||||||||||||||||||||||
| Orthologous | [Ortholog page] LOC4331544 (osa) LOC7496899 (ppo) LOC25482212 (mtr) LOC100247165 (vvi) LOC100781648 (gma) LOC100799479 (gma) LOC101247214 (sly) LOC101268635 (sly) LOC103631682 (zma) LOC103832052 (bra) LOC103853000 (bra) | ||||||||||||||||||||||||||||||
| Subcellular localization wolf |
|
||||||||||||||||||||||||||||||
| Subcellular localization TargetP |
|
||||||||||||||||||||||||||||||
| Gene coexpression | |||||||||||||||||||||||||||||||
| Network*for coexpressed genes |
|
||||||||||||||||||||||||||||||
|---|---|---|---|---|---|---|---|---|---|---|---|---|---|---|---|---|---|---|---|---|---|---|---|---|---|---|---|---|---|---|---|
| Coexpressed gene list |
[Coexpressed gene list for EMB1793] | ||||||||||||||||||||||||||||||
| Gene expression | |||||||||||||||||||||||||||||||
| All samples | [Expression pattern for all samples] | ||||||||||||||||||||||||||||||
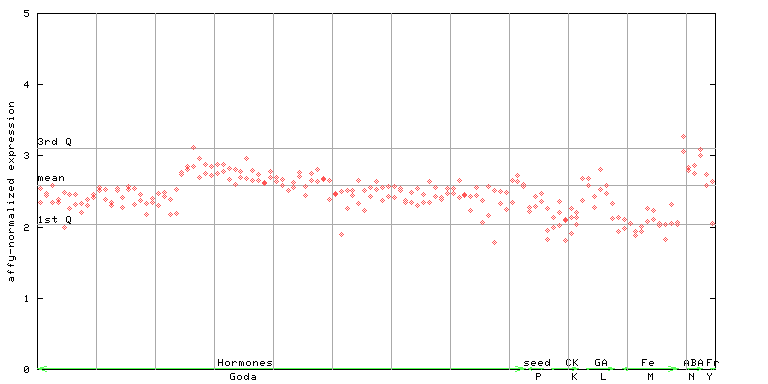
| AtGenExpress* (Development) |
262673_at
X axis is samples (pdf file), and Y axis is log2-expression. |
||||||||||||||||||||||||||||||
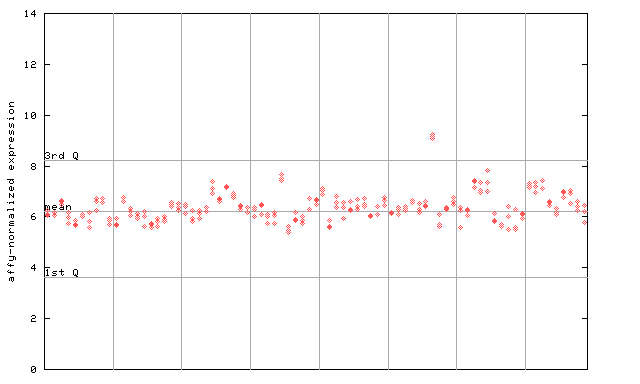
| AtGenExpress* (Stress) |
262673_at
X axis is samples (pdf file), and Y axis is log2-expression. |
||||||||||||||||||||||||||||||
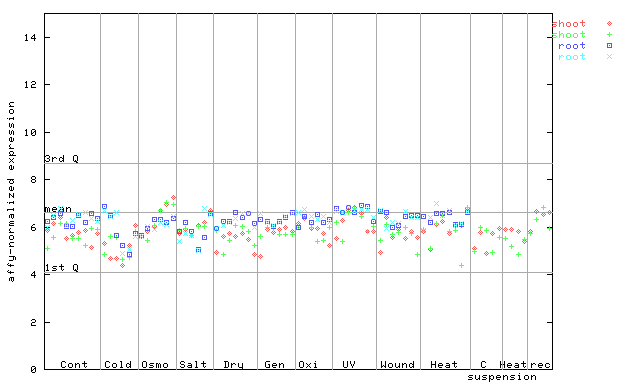
| AtGenExpress* (Hormone) |
262673_at
X axis is samples (xls file), and Y axis is log-expression. |
||||||||||||||||||||||||||||||


| Link to other DBs | ||
| Entrez Gene ID | 843938 |
|
| Refseq ID (protein) | NP_177733.2 | |
The preparation time of this page was 0.1 [sec].