[←][→] ath
| functional annotation | ||||||||||||||||||||||||||
| Function | SET domain-containing protein |


|
||||||||||||||||||||||||
| GO BP |
|
|||||||||||||||||||||||||
| GO CC |
|
|||||||||||||||||||||||||
| GO MF |
|
|||||||||||||||||||||||||
| KEGG | ||||||||||||||||||||||||||
| Protein | NP_001322965.1 NP_563658.1 | |||||||||||||||||||||||||
| BLAST | NP_001322965.1 NP_563658.1 | |||||||||||||||||||||||||
| Orthologous | [Ortholog page] LOC103843745 (bra) LOC103844718 (bra) | |||||||||||||||||||||||||
| Subcellular localization wolf |
|
|||||||||||||||||||||||||
| Subcellular localization TargetP |
|
|||||||||||||||||||||||||
| Gene coexpression | ||||||||||||||||||||||||||
| Network*for coexpressed genes |
||||||||||||||||||||||||||
|---|---|---|---|---|---|---|---|---|---|---|---|---|---|---|---|---|---|---|---|---|---|---|---|---|---|---|
| Coexpressed gene list |
[Coexpressed gene list for MEA] | |||||||||||||||||||||||||
| Gene expression | ||||||||||||||||||||||||||
| All samples | [Expression pattern for all samples] | |||||||||||||||||||||||||
| AtGenExpress* (Development) |
260908_at
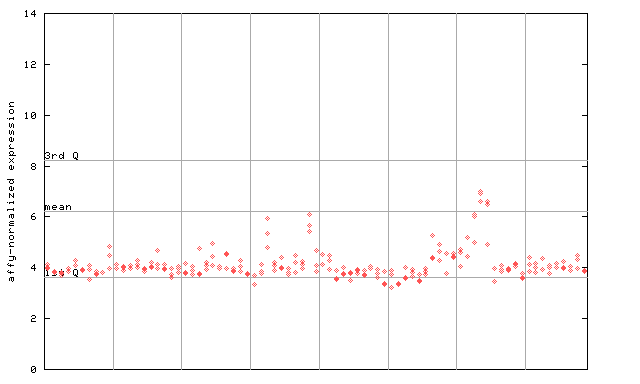
X axis is samples (pdf file), and Y axis is log2-expression. |
|||||||||||||||||||||||||
| AtGenExpress* (Stress) |
260908_at
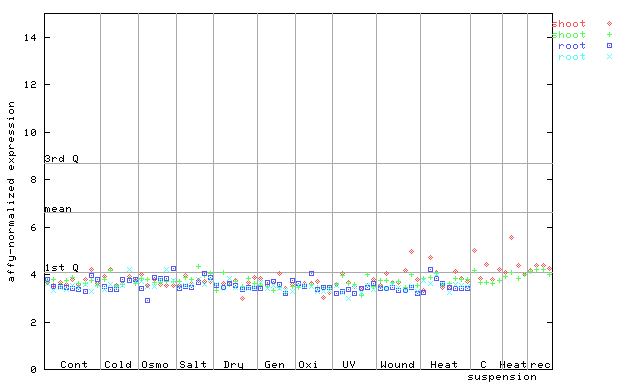
X axis is samples (pdf file), and Y axis is log2-expression. |
|||||||||||||||||||||||||
| AtGenExpress* (Hormone) |
260908_at
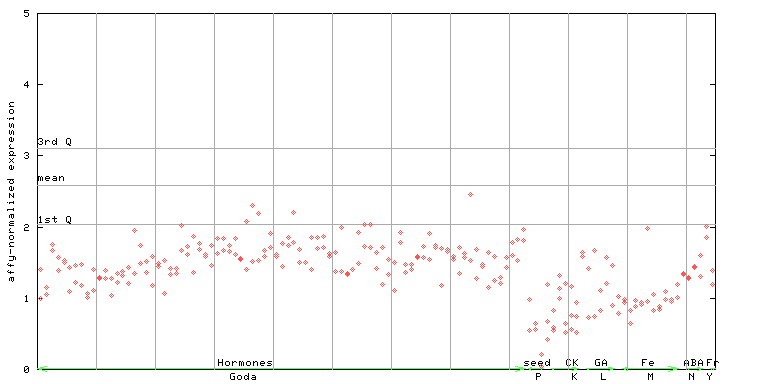
X axis is samples (xls file), and Y axis is log-expression. |
|||||||||||||||||||||||||

| Link to other DBs | ||
| Entrez Gene ID | 839422 |
|
| Refseq ID (protein) | NP_001322965.1 | |
| NP_563658.1 | |
|
The preparation time of this page was 0.4 [sec].