[←][→] ath
| functional annotation | |||||||||||||||||||||||||||||||||||||||||||||||||||||||||||||||||||||||||||||||||||||
| Function | beta glucosidase 11 |


|
|||||||||||||||||||||||||||||||||||||||||||||||||||||||||||||||||||||||||||||||||||
| GO BP |
|
||||||||||||||||||||||||||||||||||||||||||||||||||||||||||||||||||||||||||||||||||||
| GO CC |
|
||||||||||||||||||||||||||||||||||||||||||||||||||||||||||||||||||||||||||||||||||||
| GO MF |
|
||||||||||||||||||||||||||||||||||||||||||||||||||||||||||||||||||||||||||||||||||||
| KEGG | ath00460 [list] [network] Cyanoamino acid metabolism (71 genes) |  |
|||||||||||||||||||||||||||||||||||||||||||||||||||||||||||||||||||||||||||||||||||
| ath00500 [list] [network] Starch and sucrose metabolism (172 genes) | |
||||||||||||||||||||||||||||||||||||||||||||||||||||||||||||||||||||||||||||||||||||
| ath00999 [list] [network] Biosynthesis of various plant secondary metabolites; Including: Crocin biosynthesis, Cannabidiol biosynthesis, Mugineic acid biosynthesis, Pentagalloylglucose biosynthesis, Benzoxazinoid biosynthesis, Gramine biosynthesis, Coumarin biosynthesis, Furanocoumarin biosynthesis, Hordatine biosynthesis, Podophyllotoxin biosynthesis (66 genes) | |
||||||||||||||||||||||||||||||||||||||||||||||||||||||||||||||||||||||||||||||||||||
| Protein | NP_001117217.1 NP_001318909.1 NP_563666.1 NP_849578.5 NP_973746.3 | ||||||||||||||||||||||||||||||||||||||||||||||||||||||||||||||||||||||||||||||||||||
| BLAST | NP_001117217.1 NP_001318909.1 NP_563666.1 NP_849578.5 NP_973746.3 | ||||||||||||||||||||||||||||||||||||||||||||||||||||||||||||||||||||||||||||||||||||
| Orthologous | [Ortholog page] HIUHase (gma) BGLU7 (ath) BGLU8 (ath) BGLU3 (ath) BGLU9 (ath) BGLU10 (ath) BGLU1 (ath) BGLU4 (ath) BGLU5 (ath) BGLU6 (ath) LOC4326948 (osa) LOC4327593 (osa) LOC4338556 (osa) LOC4338558 (osa) LOC4338560 (osa) LOC9267759 (osa) LOC9270758 (osa) LOC11410877 (mtr) LOC11415969 (mtr) LOC11417093 (mtr) LOC11419234 (mtr) LOC11444702 (mtr) LOC25498773 (mtr) LOC25498774 (mtr) LOC100781407 (gma) LOC100781958 (gma) LOC100792223 (gma) LOC100803190 (gma) LOC100803592 (gma) LOC100804122 (gma) LOC101248047 (sly) LOC101248330 (sly) LOC103834236 (bra) LOC103842078 (bra) LOC103842079 (bra) LOC103843278 (bra) LOC103844557 (bra) LOC103856677 (bra) LOC103858255 (bra) LOC103862779 (bra) LOC103870188 (bra) LOC107276378 (osa) LOC117125636 (bra) LOC123043608 (tae) LOC123051480 (tae) LOC123060983 (tae) LOC123063233 (tae) LOC123063238 (tae) LOC123063239 (tae) LOC123065828 (tae) LOC123066220 (tae) LOC123066303 (tae) LOC123069569 (tae) LOC123071164 (tae) LOC123072145 (tae) LOC123072146 (tae) LOC123076226 (tae) LOC123078059 (tae) LOC123079521 (tae) LOC123079525 (tae) LOC123080424 (tae) LOC123080426 (tae) LOC123080428 (tae) LOC123092342 (tae) LOC123138890 (tae) LOC123169383 (tae) LOC123412171 (hvu) LOC123440401 (hvu) LOC123443407 (hvu) LOC123444677 (hvu) LOC123444678 (hvu) LOC123445332 (hvu) LOC123445335 (hvu) LOC123445336 (hvu) | ||||||||||||||||||||||||||||||||||||||||||||||||||||||||||||||||||||||||||||||||||||
| Subcellular localization wolf |
|
||||||||||||||||||||||||||||||||||||||||||||||||||||||||||||||||||||||||||||||||||||
| Subcellular localization TargetP |
|
||||||||||||||||||||||||||||||||||||||||||||||||||||||||||||||||||||||||||||||||||||
| Gene coexpression | |||||||||||||||||||||||||||||||||||||||||||||||||||||||||||||||||||||||||||||||||||||
| Network*for coexpressed genes |
|
||||||||||||||||||||||||||||||||||||||||||||||||||||||||||||||||||||||||||||||||||||
|---|---|---|---|---|---|---|---|---|---|---|---|---|---|---|---|---|---|---|---|---|---|---|---|---|---|---|---|---|---|---|---|---|---|---|---|---|---|---|---|---|---|---|---|---|---|---|---|---|---|---|---|---|---|---|---|---|---|---|---|---|---|---|---|---|---|---|---|---|---|---|---|---|---|---|---|---|---|---|---|---|---|---|---|---|---|
| Coexpressed gene list |
[Coexpressed gene list for BGLU11] | ||||||||||||||||||||||||||||||||||||||||||||||||||||||||||||||||||||||||||||||||||||
| Gene expression | |||||||||||||||||||||||||||||||||||||||||||||||||||||||||||||||||||||||||||||||||||||
| All samples | [Expression pattern for all samples] | ||||||||||||||||||||||||||||||||||||||||||||||||||||||||||||||||||||||||||||||||||||
| AtGenExpress* (Development) |
262118_at
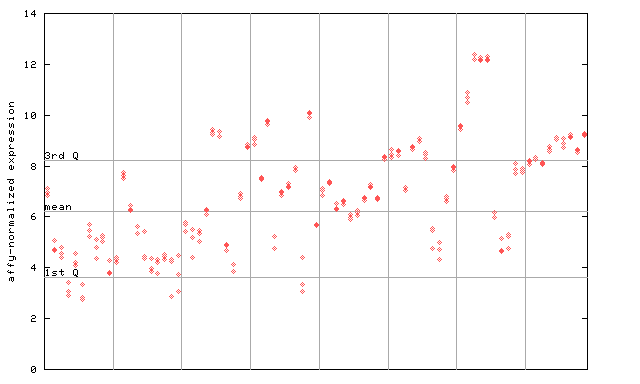
X axis is samples (pdf file), and Y axis is log2-expression. |
||||||||||||||||||||||||||||||||||||||||||||||||||||||||||||||||||||||||||||||||||||
| AtGenExpress* (Stress) |
262118_at
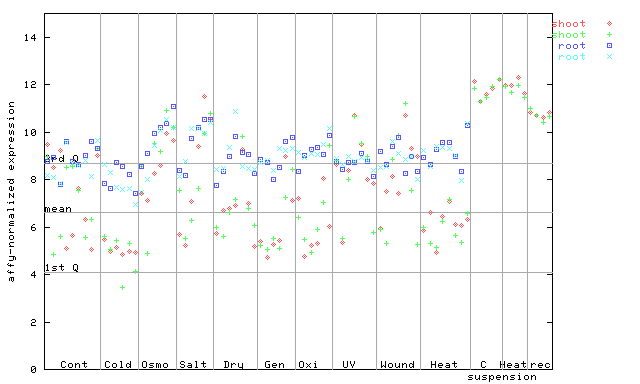
X axis is samples (pdf file), and Y axis is log2-expression. |
||||||||||||||||||||||||||||||||||||||||||||||||||||||||||||||||||||||||||||||||||||
| AtGenExpress* (Hormone) |
262118_at
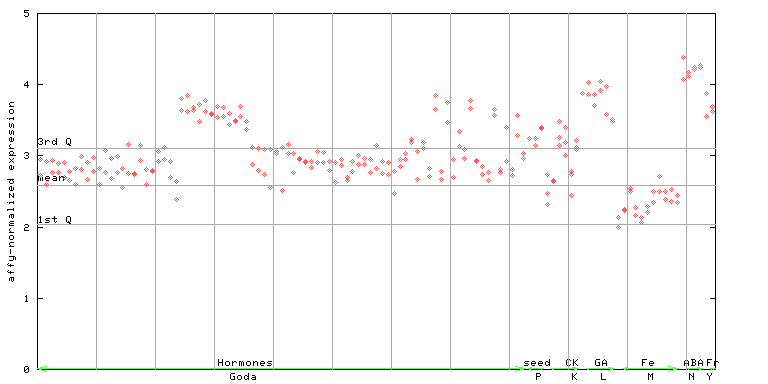
X axis is samples (xls file), and Y axis is log-expression. |
||||||||||||||||||||||||||||||||||||||||||||||||||||||||||||||||||||||||||||||||||||


")
")
")
")
")
| Link to other DBs | ||
| Entrez Gene ID | 839435 |
|
| Refseq ID (protein) | NP_001117217.1 | |
| NP_001318909.1 | |
|
| NP_563666.1 | |
|
| NP_849578.5 | |
|
| NP_973746.3 | |
|
The preparation time of this page was 0.1 [sec].