[←][→] ath
| functional annotation | ||||||||||||||||||||||||||||||||||||||||||||||||||||||||||
| Function | photosystem I subunit D-2 |


|
||||||||||||||||||||||||||||||||||||||||||||||||||||||||
| GO BP |
|
|||||||||||||||||||||||||||||||||||||||||||||||||||||||||
| GO CC |
|
|||||||||||||||||||||||||||||||||||||||||||||||||||||||||
| GO MF |
|
|||||||||||||||||||||||||||||||||||||||||||||||||||||||||
| KEGG | ath00195 [list] [network] Photosynthesis (76 genes) |  |
||||||||||||||||||||||||||||||||||||||||||||||||||||||||
| Protein | NP_171812.1 | |||||||||||||||||||||||||||||||||||||||||||||||||||||||||
| BLAST | NP_171812.1 | |||||||||||||||||||||||||||||||||||||||||||||||||||||||||
| Orthologous | [Ortholog page] LOC541791 (zma) LOC543978 (sly) PSAD-1 (ath) LOC4346326 (osa) LOC7467482 (ppo) LOC7474216 (ppo) LOC11438662 (mtr) PSAD (gma) LOC100191984 (zma) LOC100240928 (vvi) LOC100242600 (vvi) LOC100800992 (gma) LOC103836715 (bra) | |||||||||||||||||||||||||||||||||||||||||||||||||||||||||
| Subcellular localization wolf |
|
|||||||||||||||||||||||||||||||||||||||||||||||||||||||||
| Subcellular localization TargetP |
|
|||||||||||||||||||||||||||||||||||||||||||||||||||||||||
| Gene coexpression | ||||||||||||||||||||||||||||||||||||||||||||||||||||||||||
| Network*for coexpressed genes |
|
|||||||||||||||||||||||||||||||||||||||||||||||||||||||||
|---|---|---|---|---|---|---|---|---|---|---|---|---|---|---|---|---|---|---|---|---|---|---|---|---|---|---|---|---|---|---|---|---|---|---|---|---|---|---|---|---|---|---|---|---|---|---|---|---|---|---|---|---|---|---|---|---|---|---|
| Coexpressed gene list |
[Coexpressed gene list for PSAD-2] | |||||||||||||||||||||||||||||||||||||||||||||||||||||||||
| Gene expression | ||||||||||||||||||||||||||||||||||||||||||||||||||||||||||
| All samples | [Expression pattern for all samples] | |||||||||||||||||||||||||||||||||||||||||||||||||||||||||
| AtGenExpress* (Development) |
263114_at
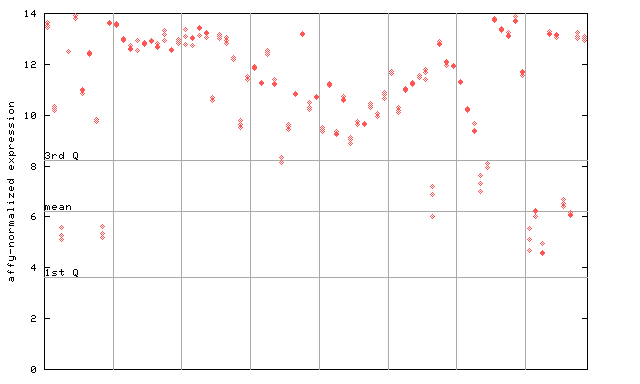
X axis is samples (pdf file), and Y axis is log2-expression. |
|||||||||||||||||||||||||||||||||||||||||||||||||||||||||
| AtGenExpress* (Stress) |
263114_at
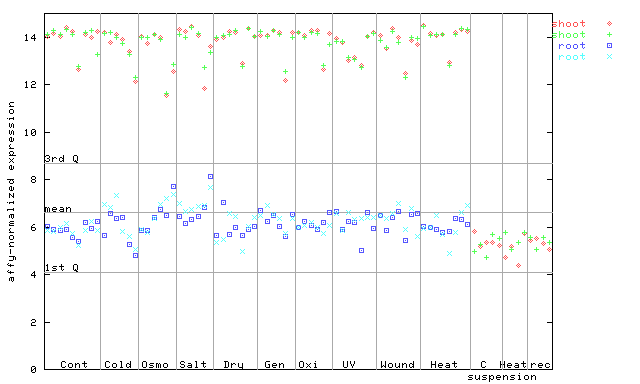
X axis is samples (pdf file), and Y axis is log2-expression. |
|||||||||||||||||||||||||||||||||||||||||||||||||||||||||
| AtGenExpress* (Hormone) |
263114_at
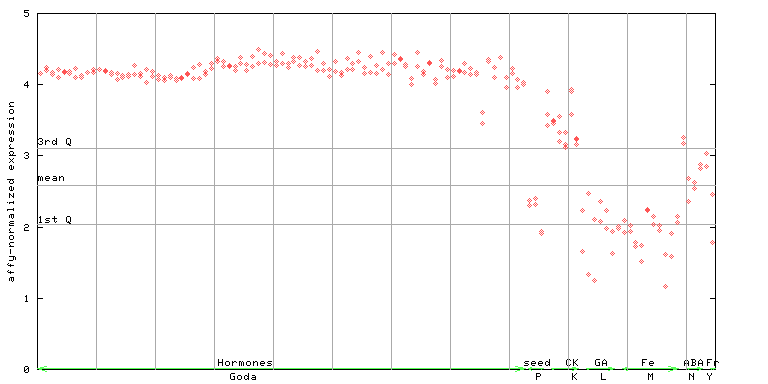
X axis is samples (xls file), and Y axis is log-expression. |
|||||||||||||||||||||||||||||||||||||||||||||||||||||||||


")
")
| Link to other DBs | ||
| Entrez Gene ID | 838400 |
|
| Refseq ID (protein) | NP_171812.1 | |
The preparation time of this page was 0.2 [sec].