[←][→] ath
| functional annotation | ||||||||||||||||||||||||||||||||||||||
| Function | glyoxalase 2-4 |


|
||||||||||||||||||||||||||||||||||||
| GO BP |
|
|||||||||||||||||||||||||||||||||||||
| GO CC |
|
|||||||||||||||||||||||||||||||||||||
| GO MF |
|
|||||||||||||||||||||||||||||||||||||
| KEGG | ath00620 [list] [network] Pyruvate metabolism (97 genes) |  |
||||||||||||||||||||||||||||||||||||
| Protein | NP_563760.1 NP_849599.1 | |||||||||||||||||||||||||||||||||||||
| BLAST | NP_563760.1 NP_849599.1 | |||||||||||||||||||||||||||||||||||||
| Orthologous | [Ortholog page] GLX2-5 (ath) GLX2-1 (ath) LOC4347581 (osa) LOC7491738 (ppo) LOC11412966 (mtr) LOC11435250 (mtr) LOC18106881 (ppo) GLYII-4 (gma) GLYII-5 (gma) GLYII-7 (gma) GLYII-9 (gma) LOC101266523 (sly) LOC103843568 (bra) LOC103857367 (bra) LOC103858069 (bra) LOC103866071 (bra) LOC103866716 (bra) LOC103867884 (bra) LOC123104420 (tae) LOC123112718 (tae) LOC123122196 (tae) LOC123399943 (hvu) | |||||||||||||||||||||||||||||||||||||
| Subcellular localization wolf |
|
|||||||||||||||||||||||||||||||||||||
| Subcellular localization TargetP |
|
|||||||||||||||||||||||||||||||||||||
| Gene coexpression | ||||||||||||||||||||||||||||||||||||||
| Network*for coexpressed genes |
|
|||||||||||||||||||||||||||||||||||||
|---|---|---|---|---|---|---|---|---|---|---|---|---|---|---|---|---|---|---|---|---|---|---|---|---|---|---|---|---|---|---|---|---|---|---|---|---|---|---|
| Coexpressed gene list |
[Coexpressed gene list for GLX2-4] | |||||||||||||||||||||||||||||||||||||
| Gene expression | ||||||||||||||||||||||||||||||||||||||
| All samples | [Expression pattern for all samples] | |||||||||||||||||||||||||||||||||||||
| AtGenExpress* (Development) |
260954_at
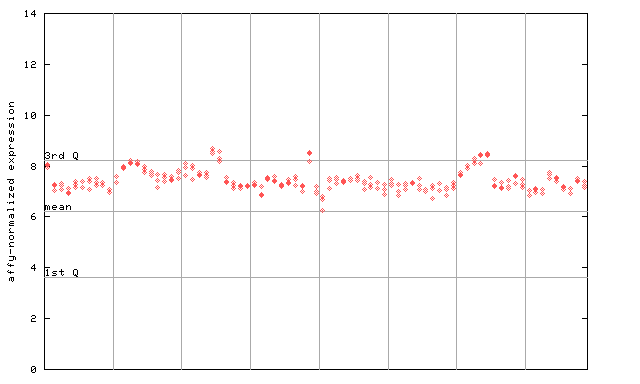
X axis is samples (pdf file), and Y axis is log2-expression. |
|||||||||||||||||||||||||||||||||||||
| AtGenExpress* (Stress) |
260954_at
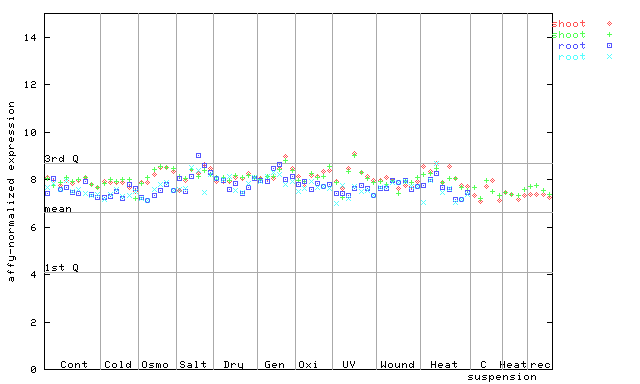
X axis is samples (pdf file), and Y axis is log2-expression. |
|||||||||||||||||||||||||||||||||||||
| AtGenExpress* (Hormone) |
260954_at
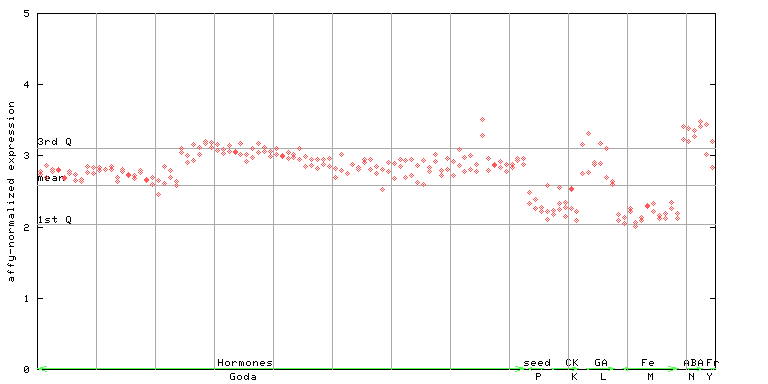
X axis is samples (xls file), and Y axis is log-expression. |
|||||||||||||||||||||||||||||||||||||


")
")
| Link to other DBs | ||
| Entrez Gene ID | 837122 |
|
| Refseq ID (protein) | NP_563760.1 | |
| NP_849599.1 | |
|
The preparation time of this page was 0.1 [sec].